
Fig. 3.
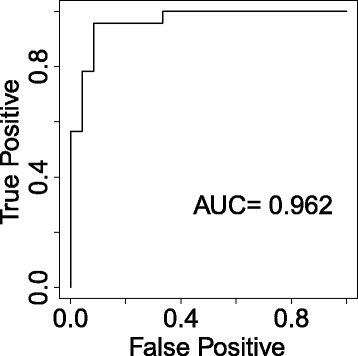
ROC curve based on the top two-pairs of miRNAs with four miRNAs (hsa-miR-191, hsa-miR-101, hsa-miR-103 and hsa-miR-222) selected by differential correlation analysis. The four miRNAs attained the highest AUC value of 0.962
Official websites use .gov
A
.gov website belongs to an official
government organization in the United States.
Secure .gov websites use HTTPS
A lock (
) or https:// means you've safely
connected to the .gov website. Share sensitive
information only on official, secure websites.
ROC curve based on the top two-pairs of miRNAs with four miRNAs (hsa-miR-191, hsa-miR-101, hsa-miR-103 and hsa-miR-222) selected by differential correlation analysis. The four miRNAs attained the highest AUC value of 0.962