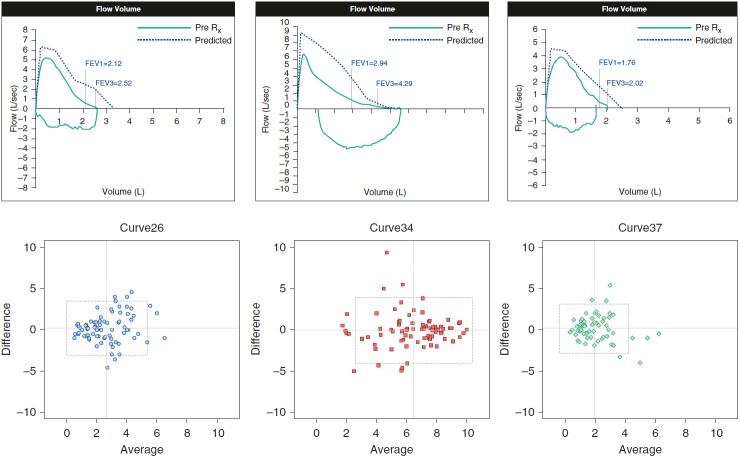
Figure 2.
Duplicated curves and intrarater reliability. Modified Bland–Altman plots show difference versus average of scores for the duplicated loops. Cross-hairs represent means for each measure. Boxes represent means ± 1.96 SD for the difference (horizontal dashed lines) and the average (vertical dashed lines). Rx = prescription.

