Figure 2.

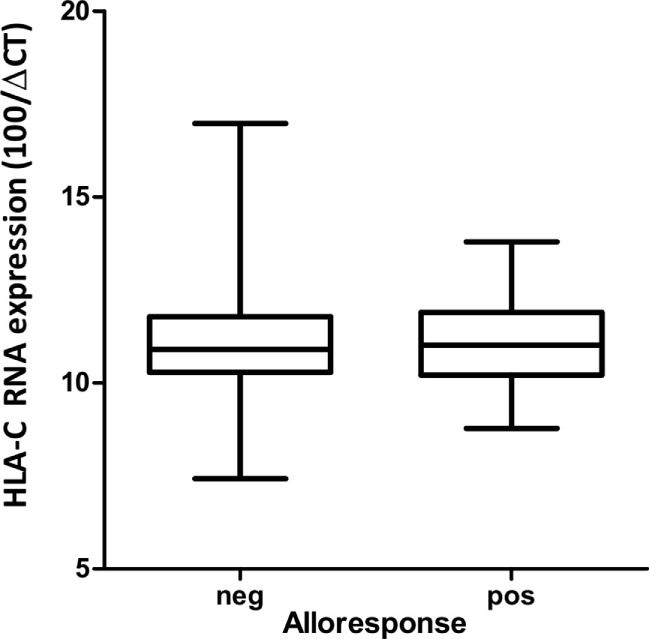
Box and whisker plots of HLA-C mRNA expression quantified by RT-PCR in stimulator cells at day 0 inducing a negative versus a positive (cutoff = 2% ΔCD137+CD8+ cells) alloresponse.

Box and whisker plots of HLA-C mRNA expression quantified by RT-PCR in stimulator cells at day 0 inducing a negative versus a positive (cutoff = 2% ΔCD137+CD8+ cells) alloresponse.