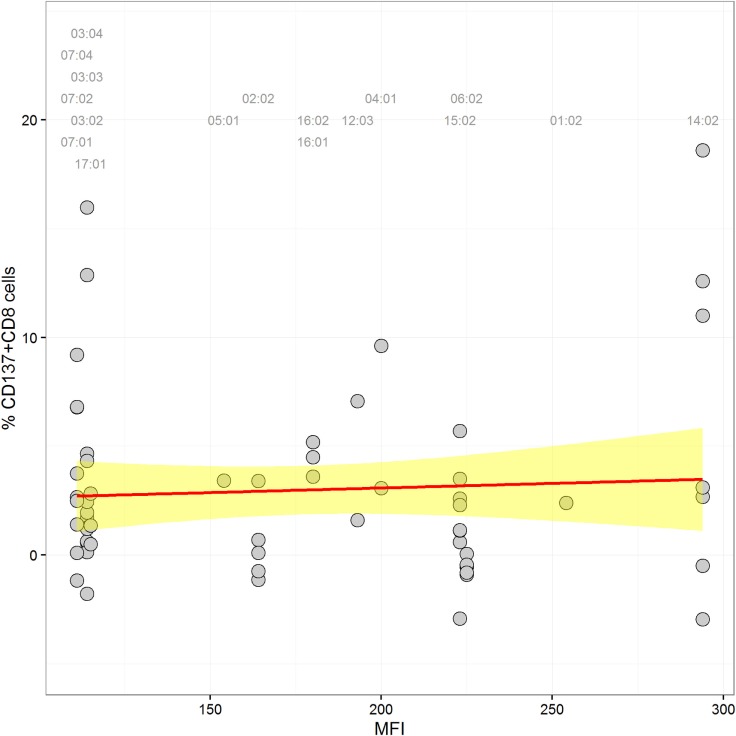
Figure 3.
Scatter plot of HLA-C expression [mean fluorescence intensity (MFI) values according to Ref. (5, 15)] and alloreactivity (%ΔCD137+CD8+ cells). A label is plotted for each stimulator allele at the top of the graph, indicating its corresponding MFI value. The linear regression through the data points is shown in red, and the confidence interval is in yellow (coefficient = 0.004, p = 0.637).

