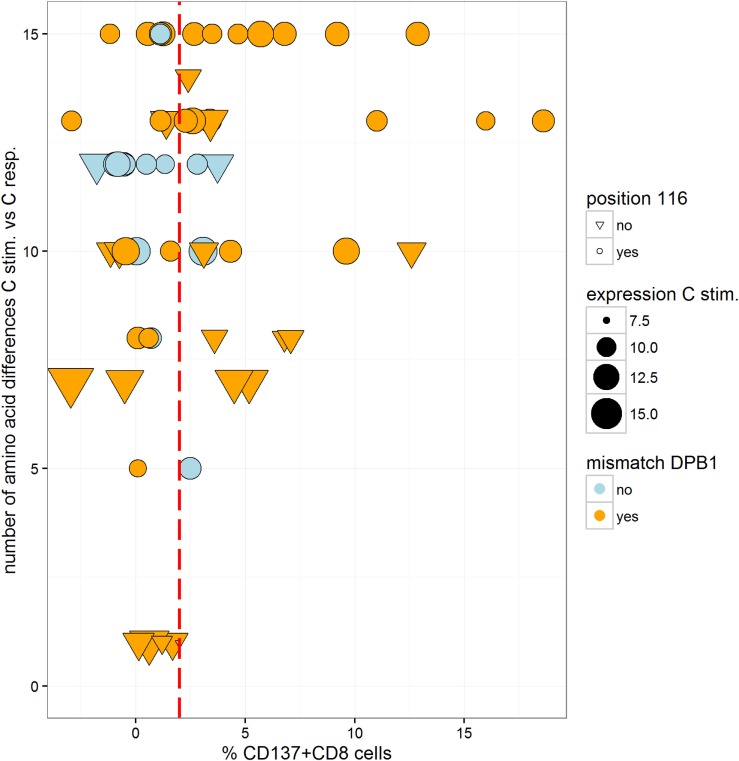
Figure 5.
Scatter plot of the number of mismatched residues at HLA-C between the stimulator and the responder allele and alloreactivity (%ΔCD137+CD8+ cells). Information on several predictor variables is plotted: matching at HLA-DPB1 is indicated by two different colors (blue for matched and orange for mismatched HLA-DPB1), mRNA expression of the stimulator HLA-C allele is indicated by the size of the dots, while variation at position 116 is indicated by the shape of the dots (a reversed triangle for matched and a circle for mismatched). The cutoff value considered for positive/negative alloreactivity is shown by the red dotted line.

