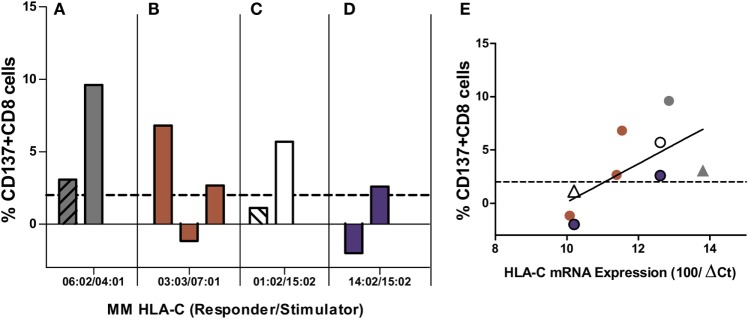
Figure 7.
Mixed lymphocyte reactions (MLRs) between different HLA-C MM stimulators and the same responder. Each panel represents MLRs between responder cells isolated from the same individual and HLA-C MM stimulator cells from two to three different individuals. MLRs of each panel were performed in parallel (i.e., at the same time) for each experiment and represent four different HLA-C MM: the mismatched HLA-C alleles of the responder and the stimulator are indicated below each panel. Alloresponses are given as %ΔCD137+CD8+ cells (2% cutoff indicated by the dashed line). All pairs were DPB1 incompatible except two pairs [dashed bars in (A,C)]. (E) shows the correlation between HLA-C mRNA expression of the stimulator cells and the induced alloresponse (%ΔCD137+CD8+ cells): r = 0.42, p = 0.056. Triangles correspond to HLA-DPB1-matched pairs. All other MLRs were HLA-DPB1 mismatched. Colors in (E) correspond to those used in (A–D).

