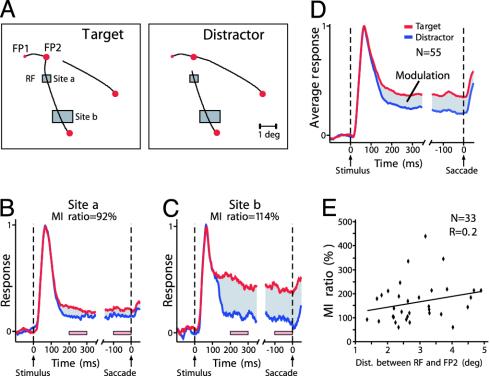
Fig. 2.
Attentional modulation of V1 responses evoked by curve segments relevant for the second saccade, while the monkey fixates on FP1. (A) Complementary stimuli. Rectangles depict the locations of V1 receptive fields (RFs) at two recording sites. At stimulus onset, the RFs were located on segments of the target curve (Left) or the distractor curve (Right). (B and C) Responses to target and distractor curve at these recording sites as the monkey fixated on FP1. Responses are aligned on stimulus onset and the start of the saccade. Red and blue traces show the responses to target and distractor curve, respectively. Gray area, difference between these responses. Pink bars, time windows used to compute the modulation index. The distance between the RF and FP2 was 1.3° for site a and 3.7° for site b. (D) Population responses averaged across 55 recording sites. (E) Distribution of the modulation index ratio of sites (33 of 55) with a significant response modulation as a function of the distance between the RF and the first saccade target (FP2).

