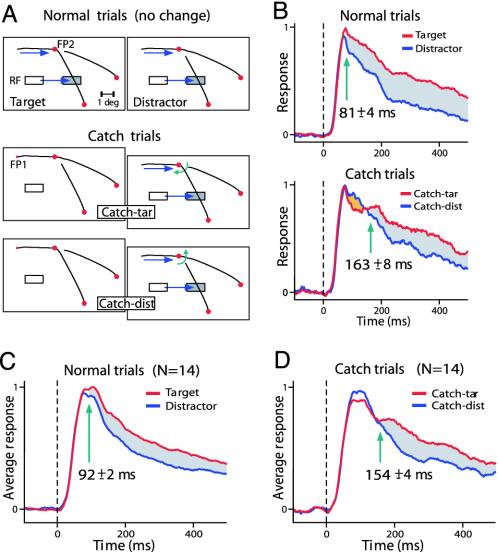
Fig. 4.
Early postsaccadic response modulation is determined by the presaccadic stimulus configuration. (A) The saccade to FP2 brought the RF onto the target or distractor curve. On normal trials, no change occurred in the stimulus. On catch trials, however, a change triggered by the first saccade introduced a mismatch between the pre- and the postsaccadic stimulus. White and shaded rectangles depict pre- and postsaccadic location of the RF, respectively. RF eccentricity, 3°. (B) Response to the target and distractor curve on normal (Upper) and catch (Lower) trials. Green arrow, latency of modulation. Note that on catch trials, the initial response is strongest on catch-dist trials (orange area). After some delay, the response on catch-tar trials (red line) becomes strongest. (C and D) Population response (n = 14) on normal trials (C) and on catch trials (D).

