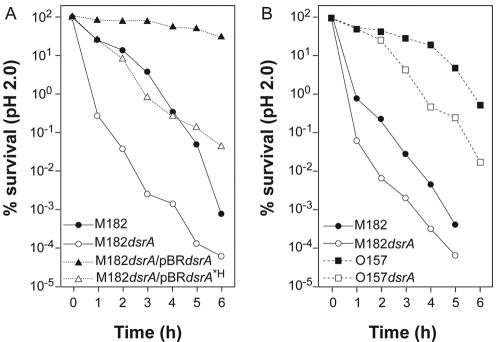
FIG. 2.
Plating assay for acid resistance. The percent survival of E. coli and isogenic dsrA mutants and overexpressers is plotted against time spent at pH 2.0. (A) Comparison of K-12 strain M182 with different levels of DsrA and DsrA*H. Filled circles represent wild-type M182, and open circles represent dsrA::cat, a null variant of M182. Filled triangles represent dsrA::cat complemented with wild-type DsrA from a plasmid; open triangles represent dsrA::cat complemented with the plasmid-encoded dsrA*H variant. Results are the average of three trials. The average standard deviation is <11% and never greater than 23%. (B) Comparison of K-12 strain M182 and EHEC strain O157:H7. Circles represent nonvirulent K-12 strain M182; squares represent pathogenic E. coli O157:H7. Filled symbols represent dsrA+ strains; open symbols represent dsrA mutant strains. Representative data are shown from at least three independent trials; all trials gave similar trends, but with sufficient variability that the data were not superimposable.

