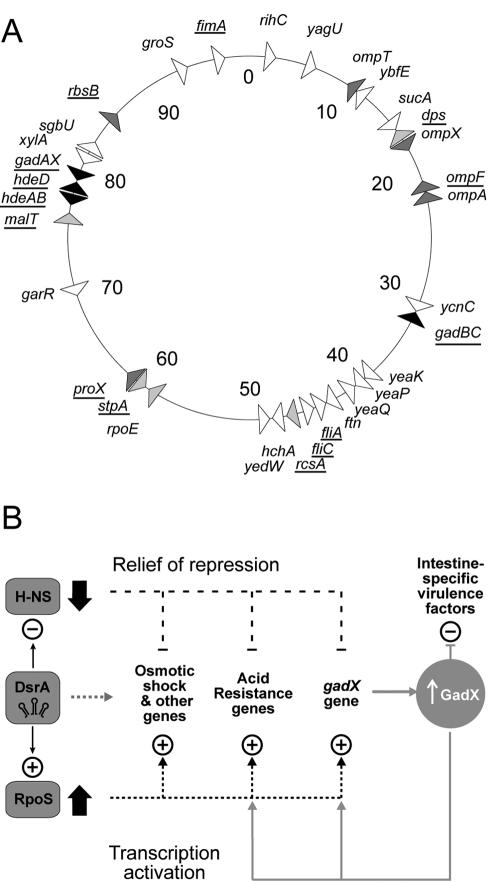
FIG. 3.
Control by DsrA. (A) Map of DsrA-responsive loci. Triangles indicate the direction of gene transcription. Black, acid resistance genes; light grey, osmotic-shock genes; dark grey, regulatory genes; white, other genes. Genes known to be H-NS/RpoS regulated are underlined (see the supplemental material for references). (B) DsrA regulatory circuits. +, activation; −, repression. Different environmental signals lead to increased DsrA, which binds hns mRNA to block translation and binds rpoS mRNA to increase translation (left) (17). A decrease in H-NS protein (↓) relieves the repression of genes, as an increase in RpoS protein (↑) coordinately activates transcription of genes, resulting in increased acid resistance and virulence. A grey dashed line to the right of DsrA shows putative direct DsrA binding to other target mRNAs. A secondary GadX circuit (solid gray lines) maintains acid resistance and blocks the production of strain-specific virulence factors, such as Per and LEE, as described in the text.

