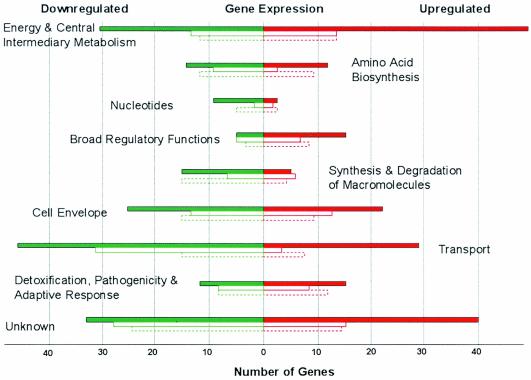
FIG. 1.
Functional classification of chromosomal thermoregulated genes of Y. pestis. Colors represent upregulated (red) and downregulated (green) genes, and bars correspond to the number of differentially expressed genes at the 1- (closed bar), 4- (open solid line bar), and 10-h (open dashed line bar) time points. The functional category assignment was based on the annotated genome of Y. pestis CO92 (23).

