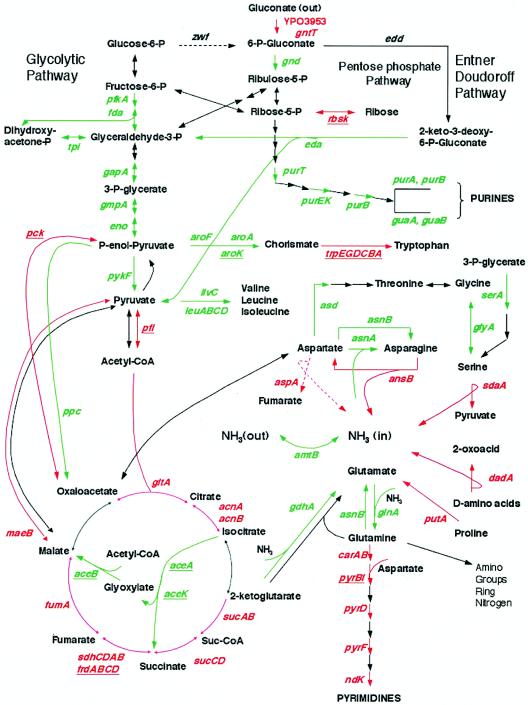
FIG. 3.
Y. pestis primary metabolic pathways affected by shift of growth temperature. The colors show the expression changes upon shift in growth temperature from 26 to 37°C. The red arrows and the green arrows represent the genes induced and repressed at 37°C, respectively. The gene names are colored in the same way as the arrows with the late-regulated gene names further underlined. The dashed lines indicate enzymes known to be inactive in Y. pestis (i.e., genes zwf and aspA). The gene names are designated according to the annotated Y. pestis CO92 genome (23). The amount of change is listed in Table 2 at http://bbrp.llnl.gov/microbial/Ypestis.

