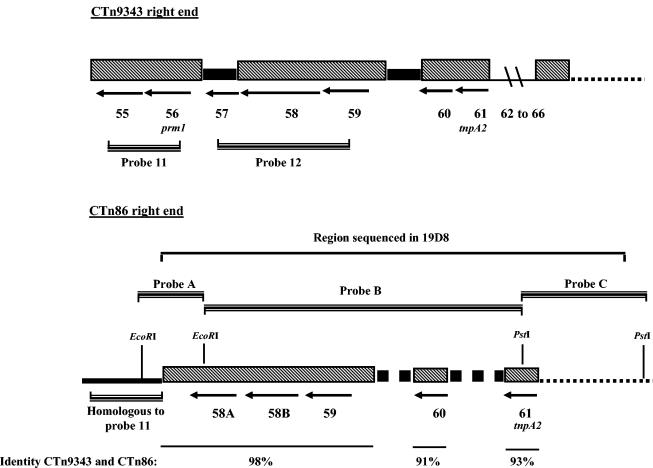
FIG. 3.
Comparison of the right ends of CTn9343 and CTn86. The thick black bars in CTn9343 and dotted thick bars in CT86 show DNA regions specific for CTn9343 and CTn86, respectively. Location of the region homologous to probe 11 used to screen the ETBF 86-5443-2-2 cosmid library is shown for CTn86. Arrows indicate the location of the ORFs and the direction of their transcription. The chromosomal DNA flanking the right ends of CTn86 and CTn9343 is shown as dotted lines.

