
Figure 3.
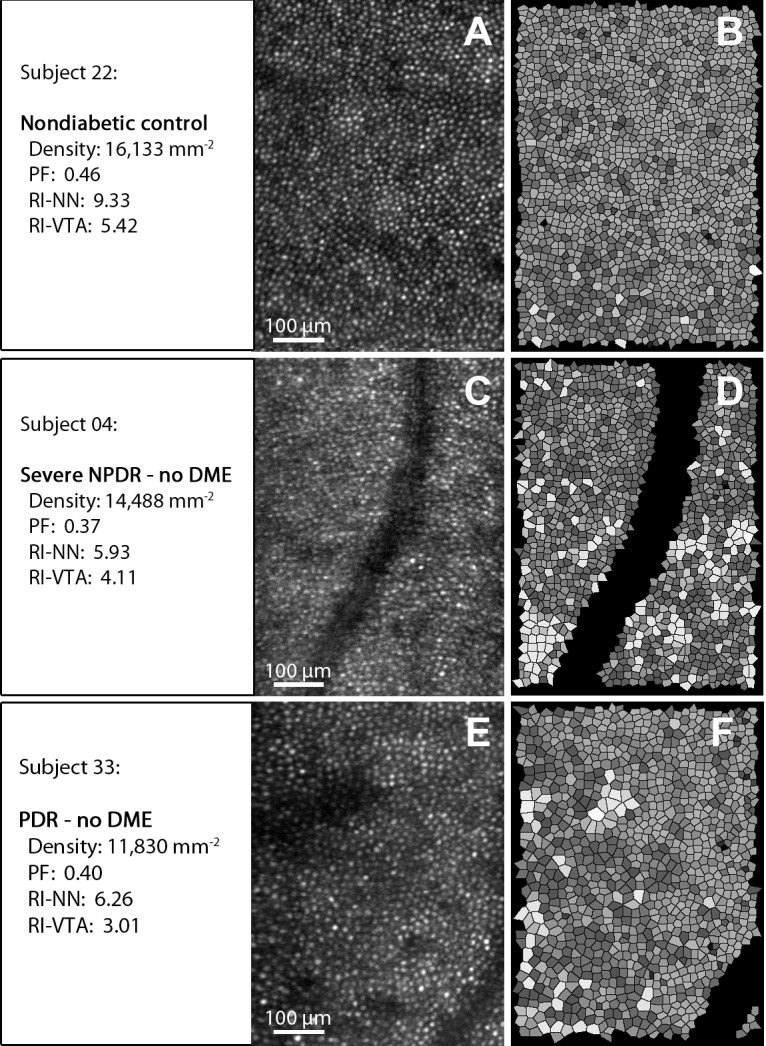
Examples of AOSLO cone reflection images (A, C, E) and corresponding Voronoi tile simulations (B, D, F). Upper row (nondiabetic control): Notice the densely packed cones (A) and the regular arrangement (B) represented by uniform shading of the Voronoi tiles. Middle (severe nonproliferative diabetic retinopathy [NPDR]) and bottom row (proliferative DR): Notice the reduced cone density (C, E) and reduced arrangement regularity represented by less uniformity of the shading of the corresponding Voronoi tiles (D, F). Vessels and Voronoi tiles at the edges of the image and vessel areas were excluded from the analysis (see also Methods section and Supplementary Fig. S2).