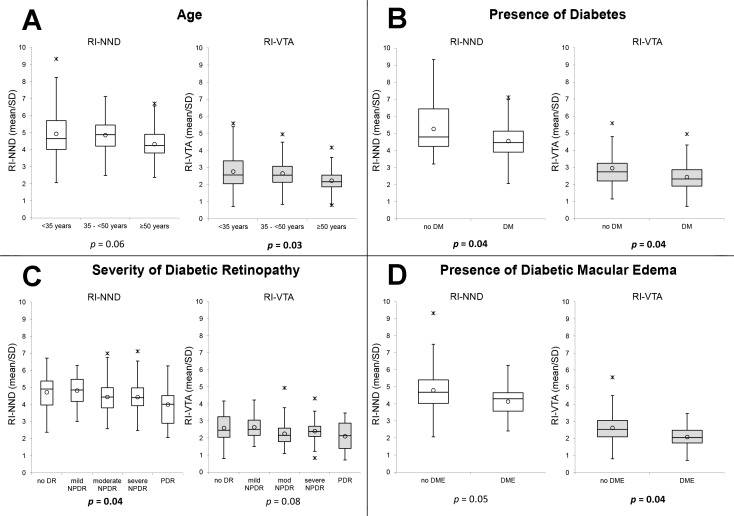
Figure 5.
Box plots of the association of age (A), presence of diabetes (B), severity of diabetic retinopathy (C), and presence of diabetic macular edema (D) with the regularity indices of nearest neighbor distance and Voronoi tile area in macular quadrants. Regularity index (RI) calculated as mean/SD. RI-NND, regularity index of nearest neighbor distance; RI-VTA, regularity index of Voronoi tile area; DM, diabetes; DR, diabetic retinopathy; NPDR, nonproliferative diabetic retinopathy; PDR, proliferative diabetic retinopathy. Circle: mean; horizontal lines: median; asterisk: upper/lower outlier.

