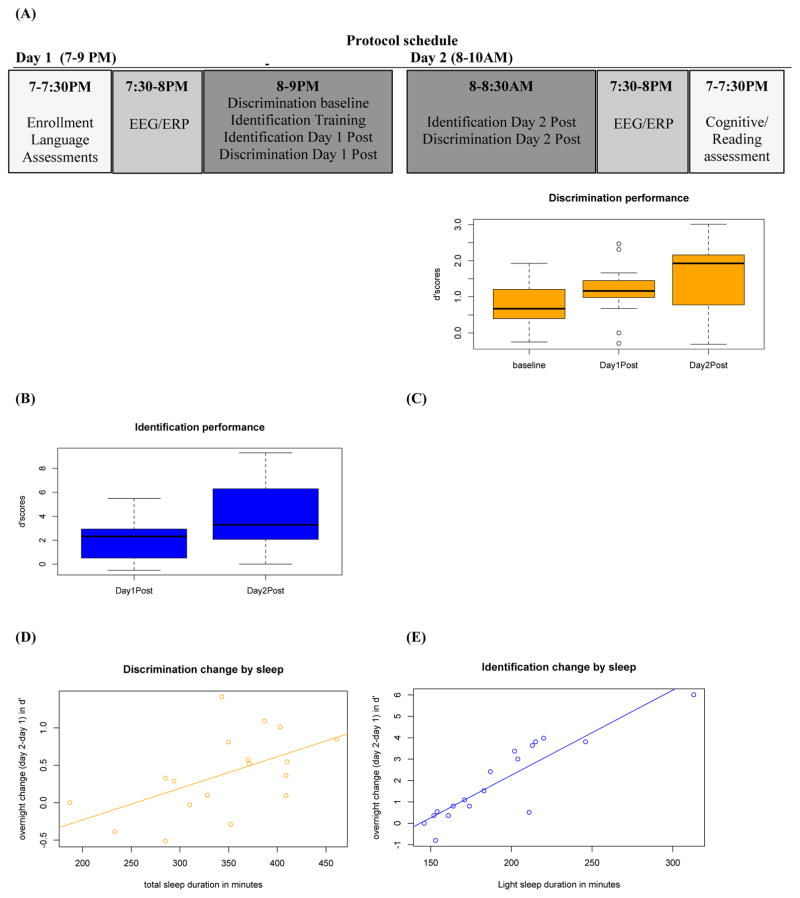
FIGURE 1. Perceptual performance over time and relationships with sleep duration.
(A) Schedule of tasks in the study protocol.
(B, C) Mean perceptual task performance by time point: before training on day 1 (baseline), immediately following training on day 1 (day 1 post), and 12 hours later (day 2 post). Performance is measured by d′ scores (y-axis).
(D, E) Relationships between individual differences in sleep duration and the overnight change to perceptual task performance (day 2 – day 1 d′ scores on y-axis).

