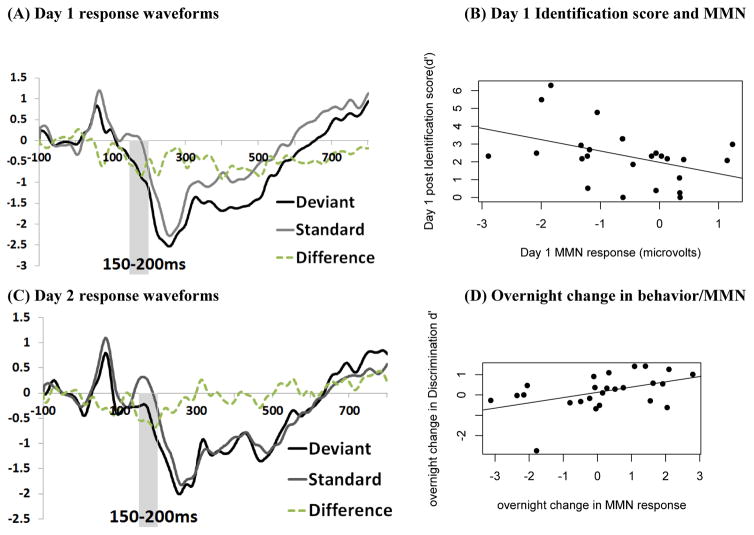
FIGURE 2. ERP responses to the target contrast and relationships with behavioral performance.
(A, C) ERP waveforms for each stimulus condition: Standard, Deviant, and Difference (Deviant minus Standard) recorded at the FZ electrode. Amplitude (y-axis) is in microvolts.
(B, D) Relationships between MMN amplitude (area under the curve 150–200 ms of the difference waveform) and behavior

