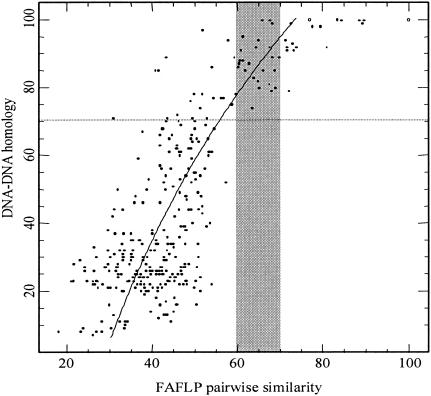
FIG. 2.
Polynomial regression (second degree) of FAFLP versus DNA-DNA homology data. FAFLP pattern pairwise similarities were calculated with the Dice coefficient, and 0.2% band position tolerance was used to allow technical errors. The diagonal (i.e., 100% theoretical values) of the DNA-DNA hybridization matrices was not included, in order to give a more realistic view of the relationship between the two techniques. The dashed line indicates the threshold (70% DNA-DNA similarity) for species-level circumscription.

