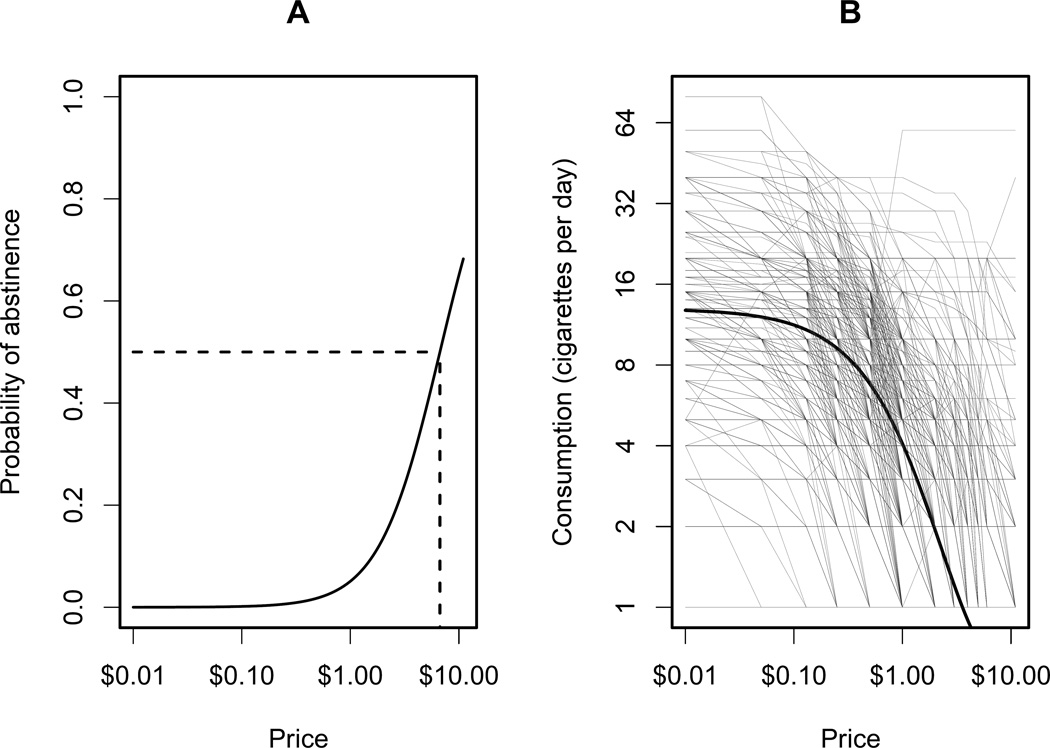
Fig. 2.
Illustration of the two-part mixed effects model using the population-average parameters estimated from the Enhanced Quit & Win data. Panel A: the probability of abstinence curve (π) based on the logistic regression of the two-part model, where the intersection of the dashed line and the curve indicates the derived breakpoint; Panel B: the consumption curve (Q) based on the nonlinear regression of the two-part model, where the gray lines represent the raw individual demand data.

