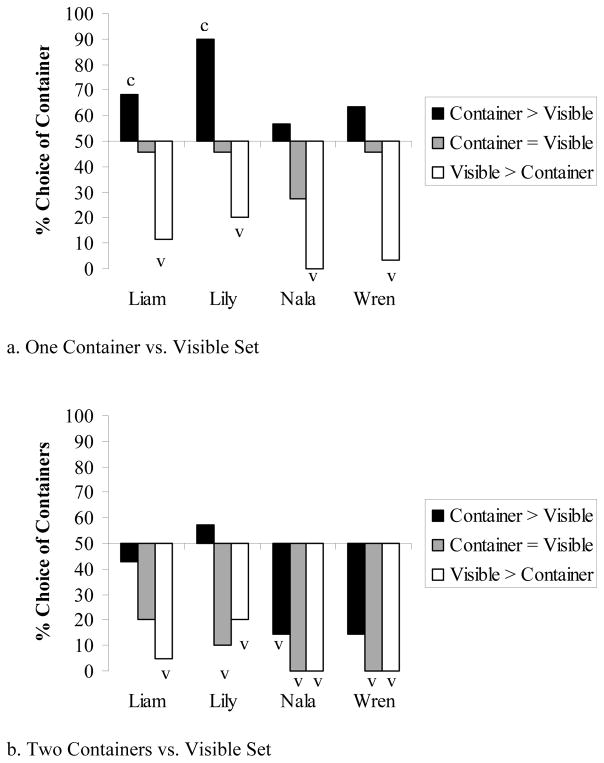
Figure 2.
The monkeys’ performance in Experiment 1, Phase 3 in which visible food items were compared to one container (a) or two food containers (b). The x-axis represents chance performance, so bars above and below the x-axis represent selection biases for the container(s) and visible food items, respectively. Lower case c’s and v’s denote statistically significant selection biases for the container option and the visible food option, respectively (two-tailed binomial test, p < 0.05).

