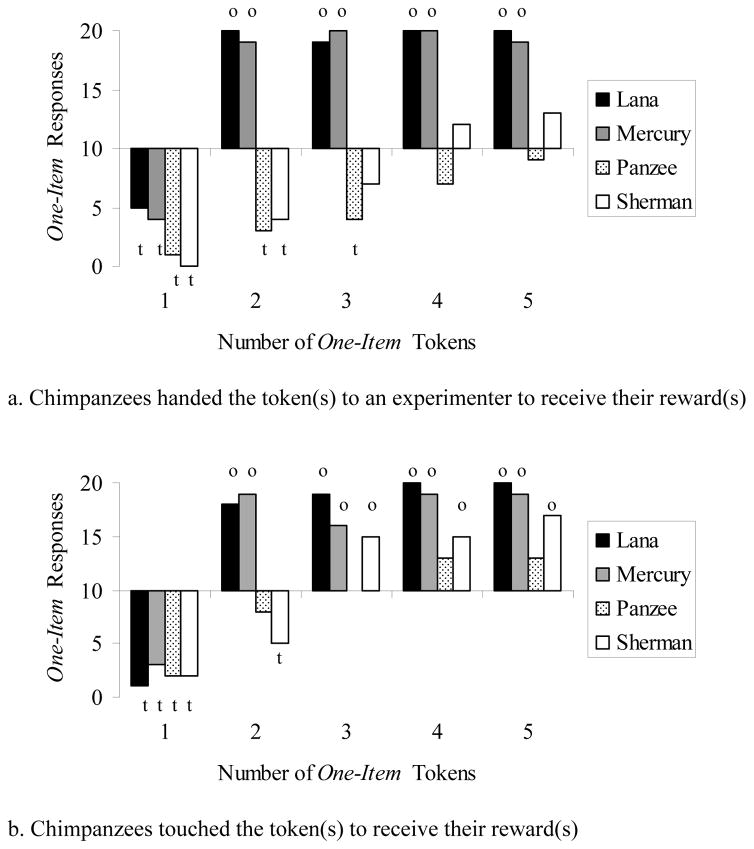
Figure 3.
Chimpanzees’ performance in Phase 2 of Experiment 1 as a function of the number of one-item tokens being compared to a single three-item token. Data are split into separate charts on the basis of general test procedure. The x-axis represents the level of chance performance, so bars above and below the x-axis represent selection biases for the one-item token(s) and three-item token, respectively. Lower case o’s and t’s denote statistically significant biases for one-item and three-item token options, respectively (two-tailed binomial test, p < 0.05). Note that Panzee only completed 15 trials of each type in the phase represented by section b.

