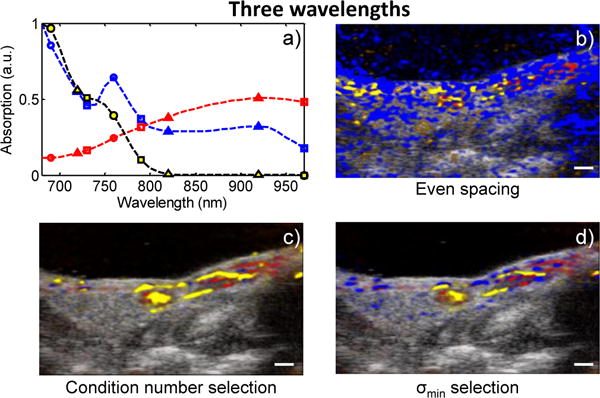
Fig. 4.

(Color online) a) The spectra of Hb (blue), HbO2 (red), and MMPSense dye (yellow) with the three selected wavelengths using even spacing (triangles), condition number selection (squares), and σmin selection (circles), and the sPA images generated from b) the evenly spaced wavelengths, c) the condition number selected wavelengths, and d) the σmin-selected wavelengths. Scale bars = 1 mm.
