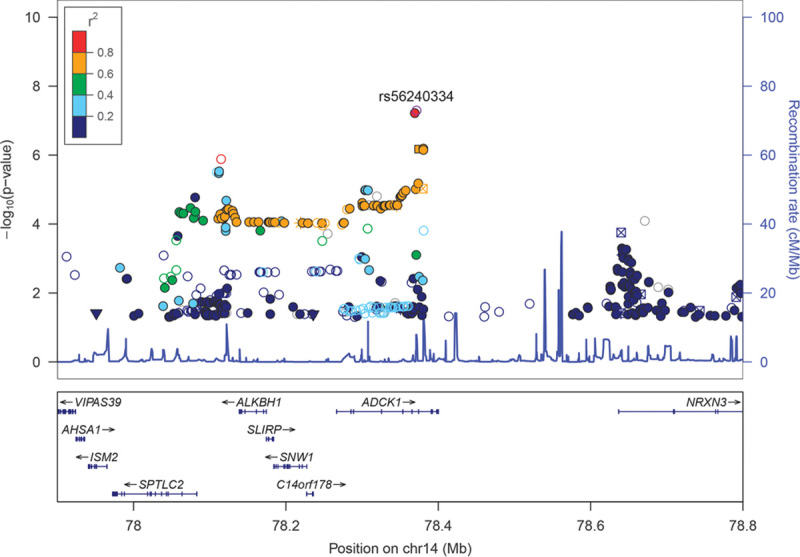
Fig. 2.

Regional plot for ADCK1. Association results [−log10(P)] are plotted for all single nucleotide polymorphisms (SNPs) passing quality control. Chromosome position is plotted with reference to the NCBI build 37. Recombination rate as estimated from the HapMap Project is plotted in light blue. SNPs are color coded according to the linkage disequilibrium measure (r2) with reference SNP based on the reference panel of CEU population from the 1000 Genome Project (March 2012 release). SNP annotation for all 1000GP SNPs are represented by the annotation categories: nonsynonymous (inverted triangle), synonymous (square), UTR (square), TFBScons (star), MCS44 Placental (square with diagonal lines), and none of the above (filled circle).
