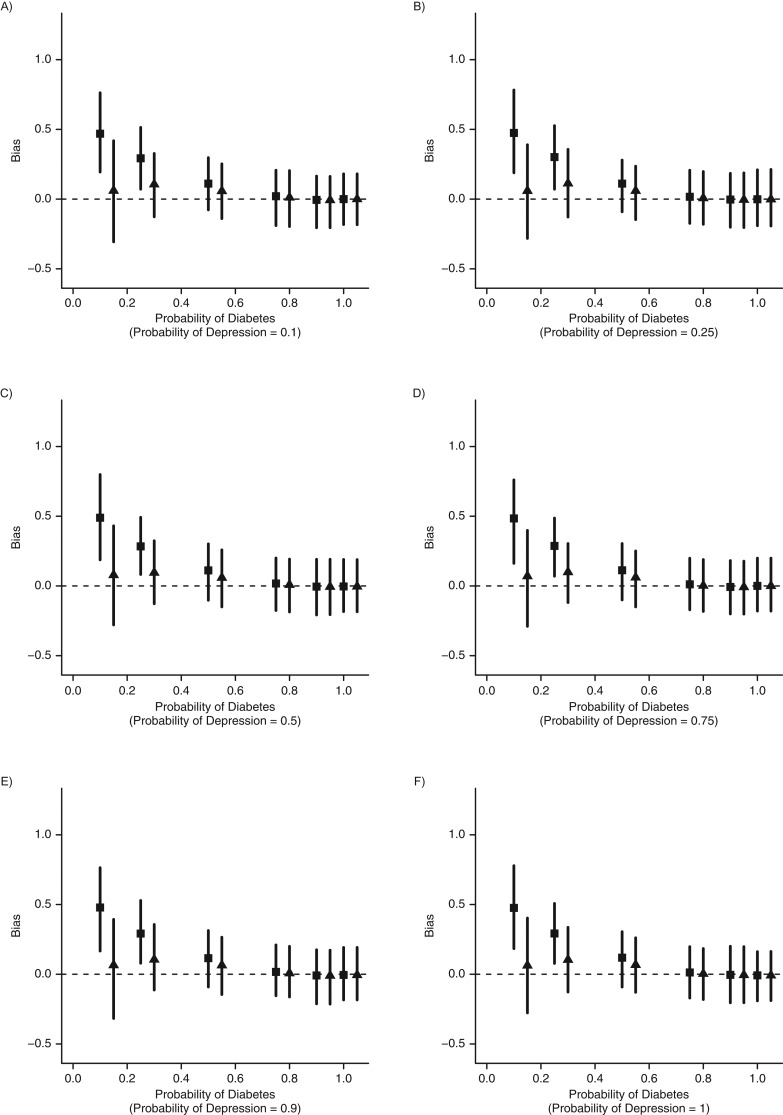
Figure 4.
Simulation results from different phenotyping algorithm sensitivities (for scenarios 2 and 4). The figure shows the estimated bias when people with disease are no more likely to have more health-care encounters than people without disease. As the quality of the phenotyping algorithm increases (moving from part A to part F and from left to right within the figure), we expect less bias due to confounding (▪, unadjusted). Adjusting for the number of health-care encounters removes this bias (▴, adjusted). However, since the number of encounters is no longer a collider, the potential for M bias is removed (part F).

