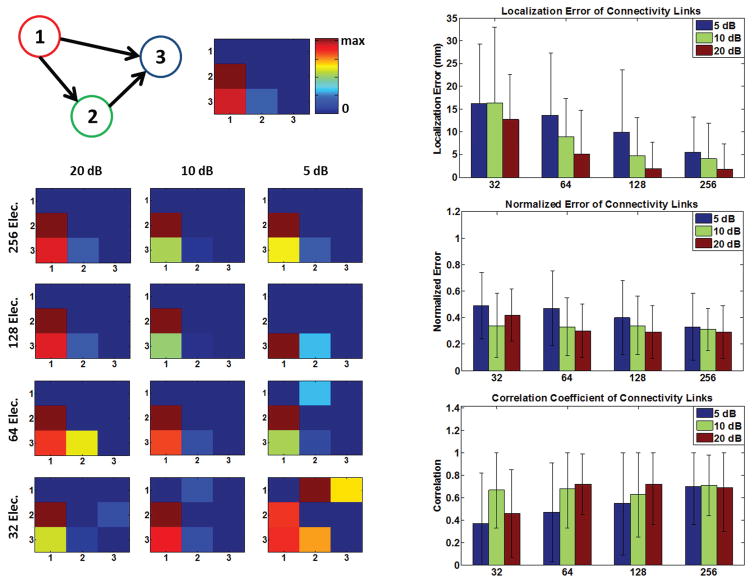
Fig. 5. Simulation results (II).
The connectivity results for a simulated network (a particular configuration: left upper panel) is presented (left column) for different electrode configurations and SNR levels, as an example. The “ground truth” network connectivity map, i.e. simulated network, is depicted in the upper middle panel. The localization error (of network nodes), and connectivity metrics are also depicted for the case where the activation time-courses are extracted from sLORETA solutions (right column). Error bars depict standard deviation. Refer to the Methods section for more details.

