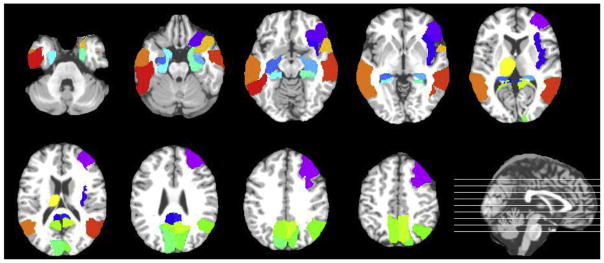
Fig. 4.
The top 20 most discriminative regions from the AAL atlas are shown in color in the axial slices. The position of each slice is marked by a line on the sagittal image at the bottom right corner. The lines from the bottom to the top correspond to the axial slices from the upper-left corner to the bottom-right corner, respectively. Abbreviation: AAL, automatic anatomical labeling. (For interpretation of the references to color in this figure legend, the reader is referred to the Web version of this article.)

