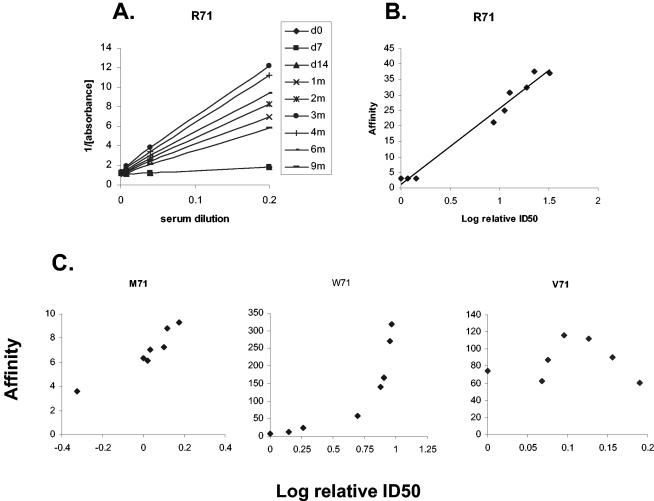
FIG. 5.
Affinity of epitope-specific antibody and its change with time. (A) Different slopes of the reciprocal of the OD for the antibody to the TB71 epitope with time. The point of intersection on the y-axis indicates that the maximal number of binding sites remained constant in the different assays. (B) The gradients from graph A have been used to calculate the affinity of the antibody, which has then been plotted against the log of the relative ID50. (C) Most subjects gave a linear relationship between affinity and ID50, but one showed an exponential relationship and one showed a bell-shaped curve. All antibody levels are those of antibody to the TB71 epitope.

