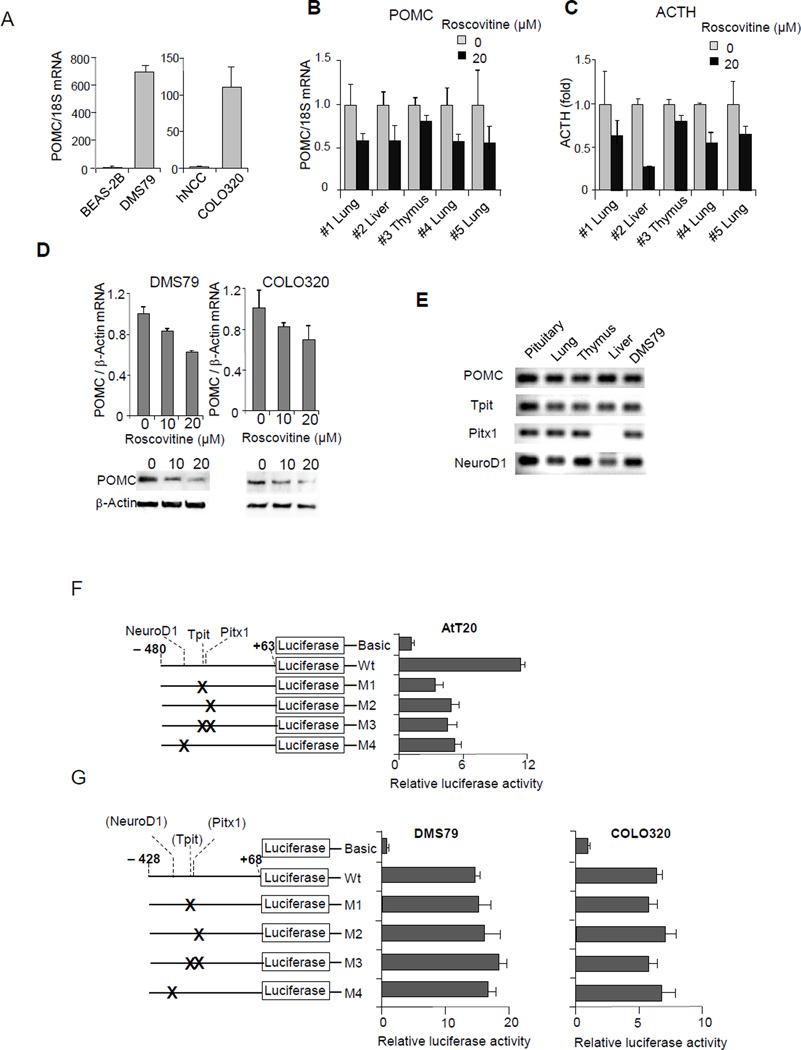
Figure 1. hPOMC promoter activity in ectopic Cushing’s cell lines.
(A) POMC expression in lung (DMS79) and colon (COLO320) cancer cell lines were analyzed by RT-PCR and compared with those in normal lung (BEAS-2B) and normal colon (hNCC) cells. Expression levels were normalized with 18S rRNA. (B-C) Primary cultures of cells from five human ectopic ACTH producing tumors (#1, #4, #5 lung; #2 liver; #3 thymus) treated with or without R-roscovitine for 48 hours. POMC mRNA were measured by RT-PCR (B) and medium ACTH concentrations in primary cultures were measured by RIA (normalized for viable cell numbers; n=5 tumors, mean ± SE) (C). (D) POMC mRNA levels were analyzed by RT-PCR using RNA derived from DMS79 and COLO320 cells treated with or without indicated doses of R-roscovitine. POMC protein levels in derived whole cell extracts were also analyzed by immunoblotting with anti-POMC. (E) POMC, Tpit, Pitx1, and NeuroD1 expression in pituitary Cushing’s tumor, ectopic Cushing’s tumors (lung, thymus, and liver), and DMS79 cells were analyzed by RT-PCR. (F) Structure of point mutated luciferase reporter plasmids of the rPomc promoter (−480/+63) (left). Luciferase assays performed using point mutations in AtT20 cells (right) were compared with those generated using negative control plasmid basic (no promoter). (G) Structure of point mutated luciferase reporter plasmids of the hPOMC promoter (−428/+68) (left). Luciferase assays performed using point mutants in DMS79 cells and COLO320 cells (right) were compared with those generated using negative control plasmid basic (no promoter). Luciferase (F, G) and RT-PCR (A, D) results are representative of four independent experiments, RIA was performed in duplicate tubes; values are mean ± SE (B, C), and immunoblotting results are representative of three independent experiments (D).

