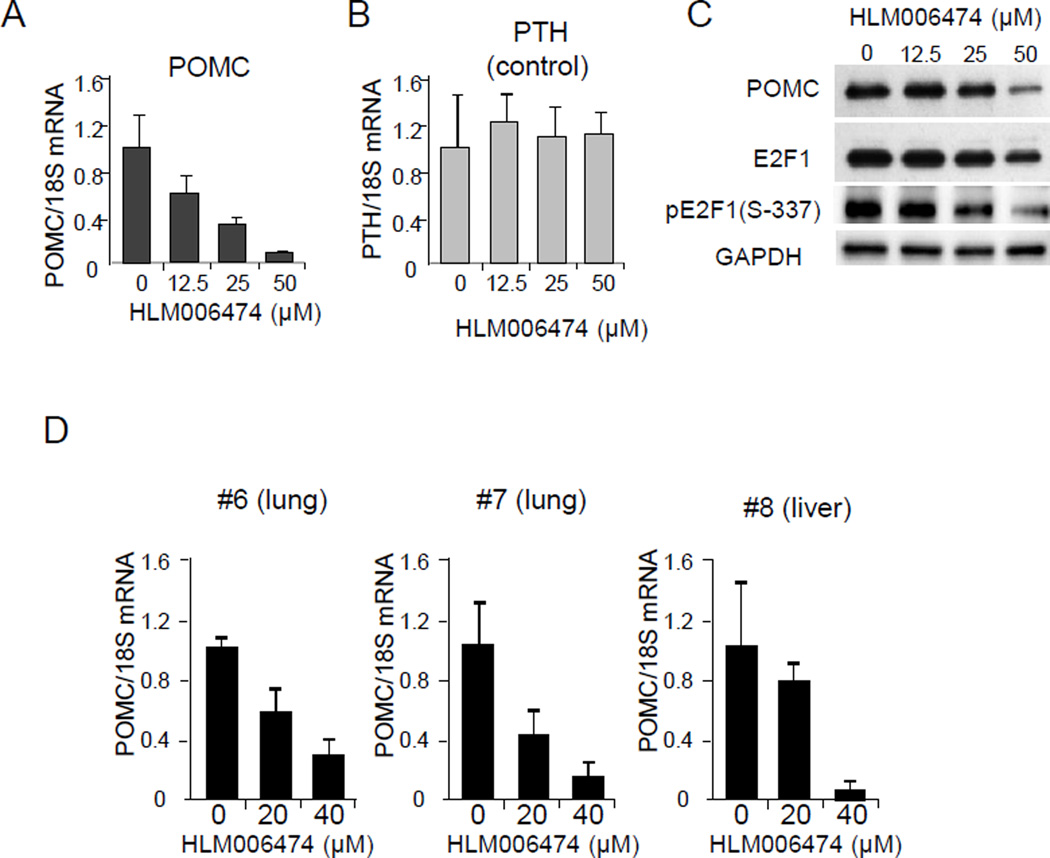
Figure 7. E2F1 inhibitors HLM006474 suppress hPOMC expression.
(A-C) DMS79 cells were treated with HLM006474 at the indicated concentrations and hPOMC (A) and hPTH (B) mRNA levels analyzed by RT-PCR. Expression levels are normalized with 18S rRNA. Immunoblotting using indicated antibodies (anti-POMC, anti-E2F1, anti-pE2F1-Ser337, and anti-GAPDH) was performed using protein extracts derived from DMS79 cells treated with HLM006474 at indicated concentrations (C). (D) Primary cultures derived from non-pituitary ACTH secreting tumors (#1-3) treated with HLM006474. hPOMC and hPTH mRNA levels were analyzed by RT-PCR and normalized with 18S rRNA. RT-PCR results from DMS79 cells are representative of four independent experiments and are depicted as mean ± SE of triplicate samples (A, B). For patient samples, RT-PCR and immunoblotting were performed in triplicate.

