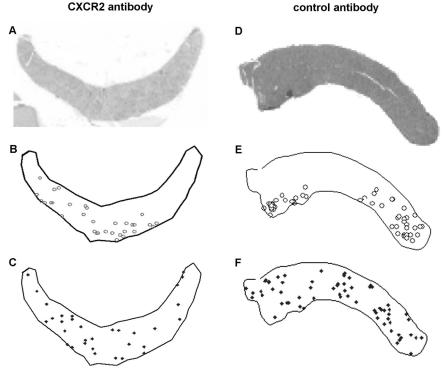
FIG. 4.
A. phagocytophilum-infected neutrophils cluster in tissues of infected SCID mice compared to randomly generated distributions of infected cells. A CXCR2 antibody-treated SCID mouse (A to C) and a control antibody-treated SCID mouse (D to F) are shown. (A and D) Low-resolution H&E-stained spleens from infected SCID mice; (B and E) the splenic outlines superimposed with coordinates of all infected cells identified by IHC; (C and F) coordinates of a computer-generated random distribution based upon the number of infected cells detected in each mouse. Note the relative lack of clustering of random distributions compared with experimentally generated data and the more intense clustering obtained in the absence of CXCR2 blockade (D to F). Similar maps were generated for each spleen examined in the initial experiments only.

