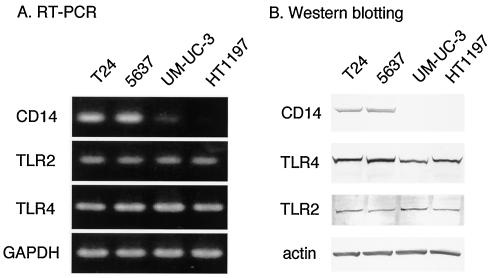
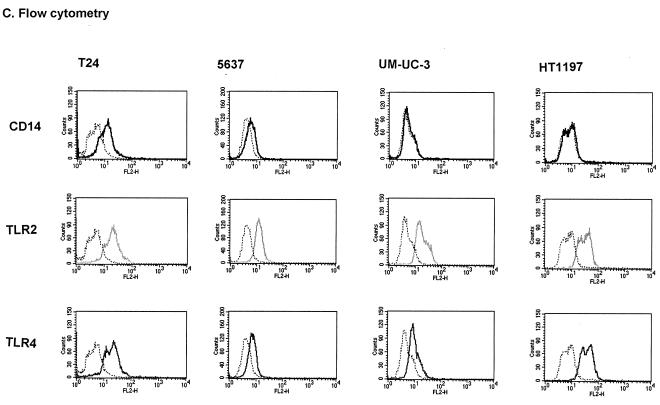
FIG. 3.
Expression of CD14, TLR2, and TLR4 in human uroepithelial cells. (A) mRNA levels estimated by RT-PCR. GAPDH mRNA was used as a control. (B) Total-protein levels determined by Western blotting. Actin was used as a control for protein loading. (C) Cell surface expression levels determined by flow cytometry. Dotted lines indicate staining with unrelated isotype-matched control antibodies.


