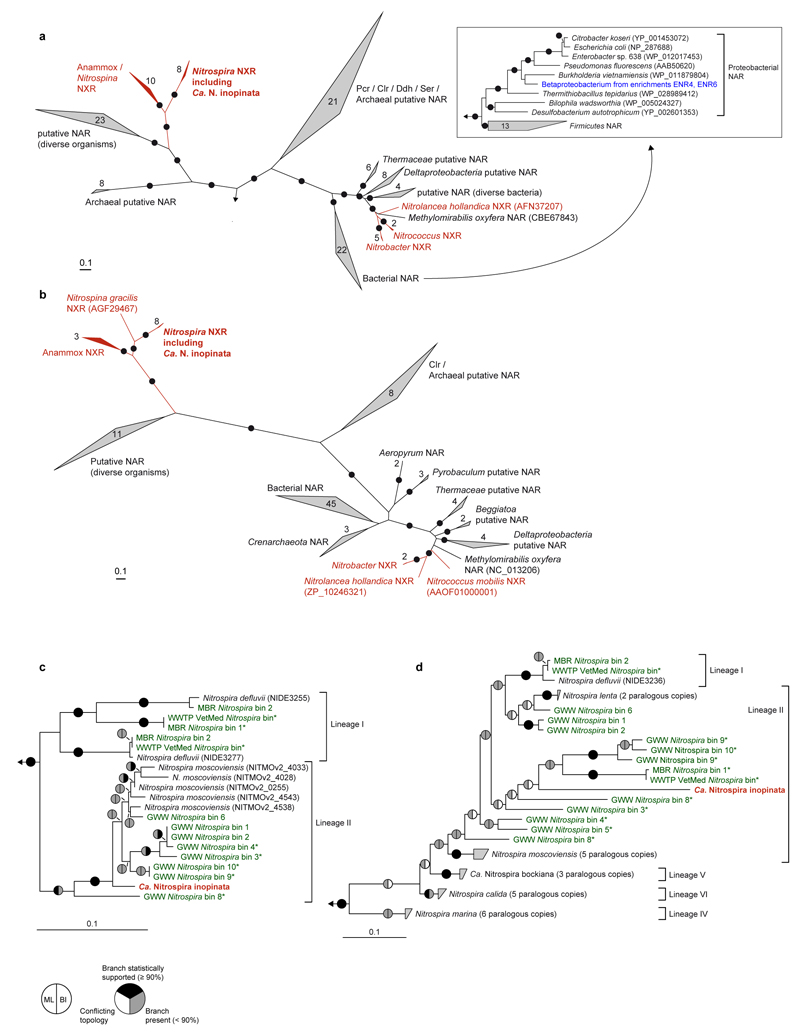
Extended Data Figure 5. Phylogeny of NXR from Ca. N. inopinata and related proteins.
a,b, Maximum likelihood trees showing the alpha (a) and beta (b) subunits of selected enzymes from the DMSO reductase type II family. Names of validated enzymes are indicated (Clr, chlorate reductase; Ddh, dimethylsulfide dehydrogenase; NAR, nitrate reductase; NXR, nitrite oxidoreductase; Pcr, perchlorate reductase; Ser, selenate reductase). More distantly related molybdoenzymes were used as outgroup. Black dots on branches indicate high maximum likelihood bootstrap support (≥ 90%; 1,000 iterations). Known NXR forms are highlighted in red. The inset in (a) contains a subtree, which shows the phylogenetic affiliation of the NAR of the betaproteobacterium from enrichments ENR4 and ENR6 (highlighted in blue) with canonical nitrate reductases of Proteobacteria. In total, 1,279 (a) and 556 (b) amino acid sequence alignment positions, and 134 (a) and 99 (b) taxa (including outgroups), were considered. c,d Maximum likelihood trees showing only Nitrospira NxrA (c) and nxrB (d) phylogenies. The tree in (d) was calculated using nucleotide sequences aligned according to their amino acid translations. Ca. N. inopinata is highlighted in red, sequences from metagenomic Nitrospira bins obtained in this study are highlighted in green. Asterisks mark metagenomic bins that also contain amo genes. Metagenomic bins are numbered as in Supplementary Table 8. Sublineages of the genus Nitrospira are indicated. As recognized earlier8, lineage II is paraphyletic with respect to lineage I in nxrB phylogenies, but differentiation of the lineages is stable. Pie charts indicate statistical support of branches based on maximum likelihood (ML; 1,000 bootstrap iterations) and Bayesian inference (BI; posterior probability, 3 independent chains). In total, 1,279 amino acid sequence alignment positions (c) and 1,290 nucleotide sequence alignment positions (d), and 30 (c) and 40 (d) taxa (including outgroups), were considered. All panels: Numbers in or next to wedges indicate the numbers of taxa. The scale bars indicate 0.1 estimated substitutions per residue.

