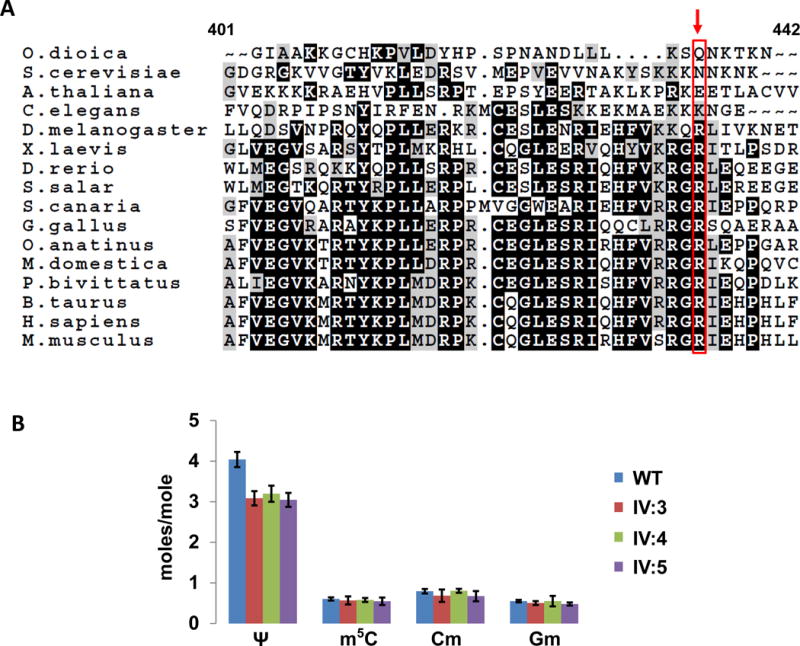
Figure 2.

A) Alignment of the C-terminal region of human PUS3. The figure shows the alignment of human PUS3 (residues 401–442) with the corresponding region from other eukaryotes as indicated. The arrow indicates site of the truncation mutation at Arg435*. B) tRNAPhe purified from LCLs of patients with the Arg435* mutation have reduced Ψ relative to that from control LCLs. Representative data are from Table 1 in the text, to show that Ψ levels are reduced in patient LCLs (by 1 mole/mole), whereas levels of each of three other modifications are not.
