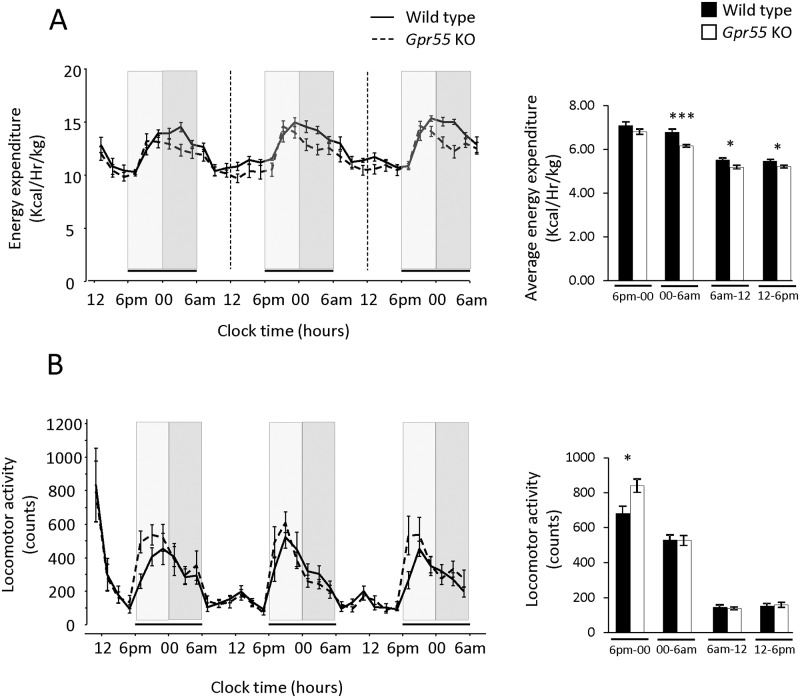
Fig 4. Energy expenditure and locomotor activity.
(A) Energy expenditure (EE, kcal hr-1 kg-1) and (B) locomotor activity was continuously assessed over 72 hours at a thermoneutral temperature in Gpr55 KO (n = 8) and corresponding WT (n = 7) mice. Light and dark grey bars indicate initial (6pm– 00) and late (00—6am) part of the night time respectively. Statistical analysis was done by 2-Way ANOVA for repeated measures with time and genotype as factors. Bar charts to the right of the line charts show average night time EE (panel (A)) and average night time locomotor activity (panel (B)). Statistical comparisons of the averaged data was done by Student′s t-test. * p < 0.05; *** p < 0.001.

