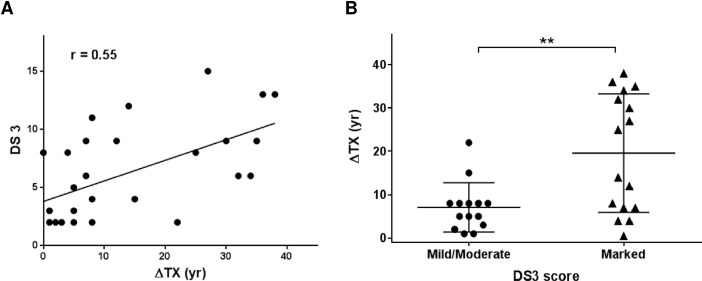
Fig 1. Correlation between delay in treatment initiation and disease severity scores.
Delay in initiation of treatment for GD (ΔTX) was plotted against disease severity score (DS3) for each patient. The trend line shows a positive Pearson correlation coefficient between the two values (r value = 0.55, P = 0.0018) (A). Subjects were divided based on their DS3 scores as being mild/moderate (DS3<5) or marked (DS3>6) and their ΔTX values were plotted. Unpaired Student’s t-test revealed P value = 0.0036 (**) indicating very significant difference (B).

