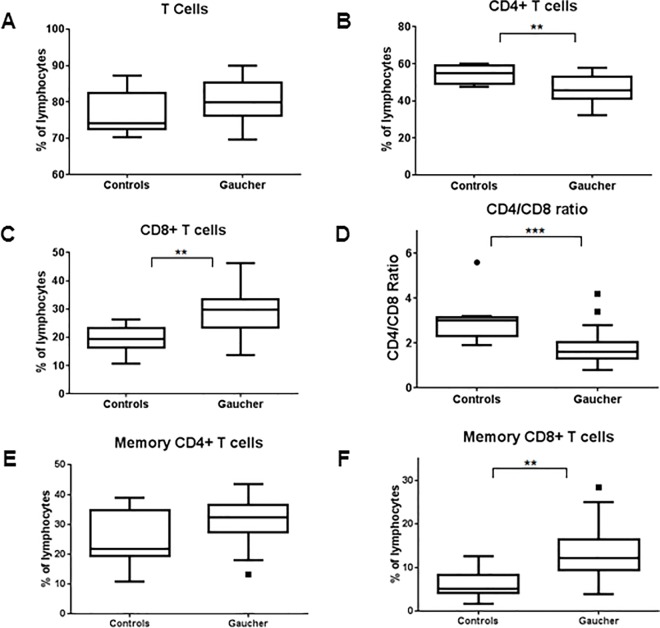
Fig 2. T-lymphocytes and subsets in GD patients.
T-lymphocytes (CD3+) from peripheral blood of GD patients and normal controls were assessed using flow cytometry and plotted as fraction of total lymphocytes (A). T helper cells (CD3+/CD4+) (B) and cytotoxic T cells (CD3+/CD8+) (C) were calculated and a ratio of CD4 to CD8 cells was plotted (D). Similarly memory subsets of CD4 (CD3+/CD4+/CD45RO+) and CD8 T cells (CD3+/CD8+/CD45RO+) were calculated and plotted against normal controls (E, F). Unpaired student’s t-test was performed to calculate significance values and included in the plots where significant difference between GD and normal controls was observed.

