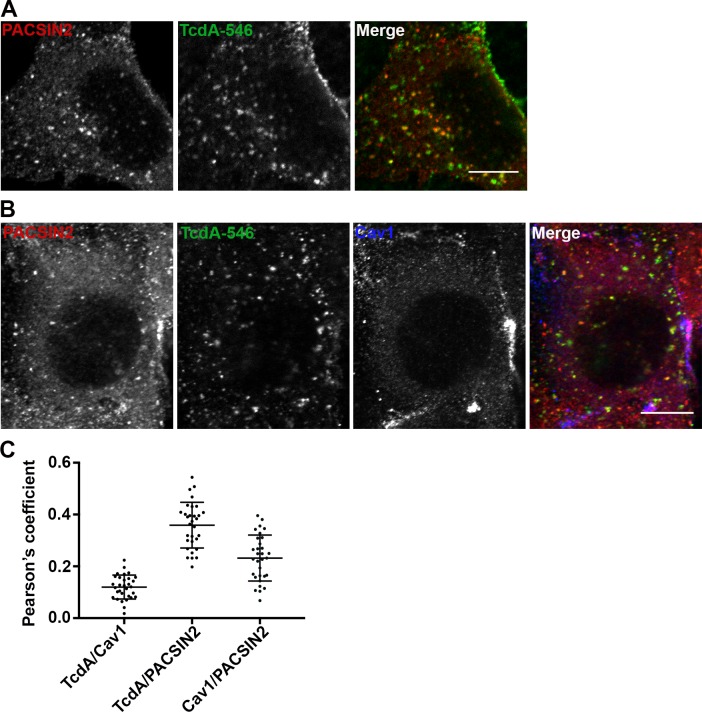
Fig 4. TcdA colocalizes with PACSIN2 in wildtype MEF cells.
(A) Wildtype MEFs on glass coverslips were allowed to bind 50 nM TcdA-546 for 45 min at 10°C, and cells were shifted to 37°C to allow internalization of toxin for 3 min. Cells were fixed, stained for PACSIN2, and analyzed by confocal microscopy. Merged images show PACSIN2 in red, toxin in green, and colocalization in yellow. Scale bars, 10 μm. The images shown are representative of multiple fields imaged from two independent experiments. (B) Immunofluorescence assays were performed as described in (A), but cells were stained for cav1 in addition to PACSIN2. Merged images show PACSIN2 in red, toxin in green, and cav1 in blue. Yellow puncta in merged images denote TcdA- and PACSIN2-positive structures. Pink punta denote caveolae-associated PACSIN2. Scale bars, 10 μm. (C) Pearson’s correlation coefficient to assess the extent of colocalization between PACSIN2, cav1 and TcdA-546 after 3 min toxin uptake. Data represent mean and SD of 31 individual cells chosen at random.

