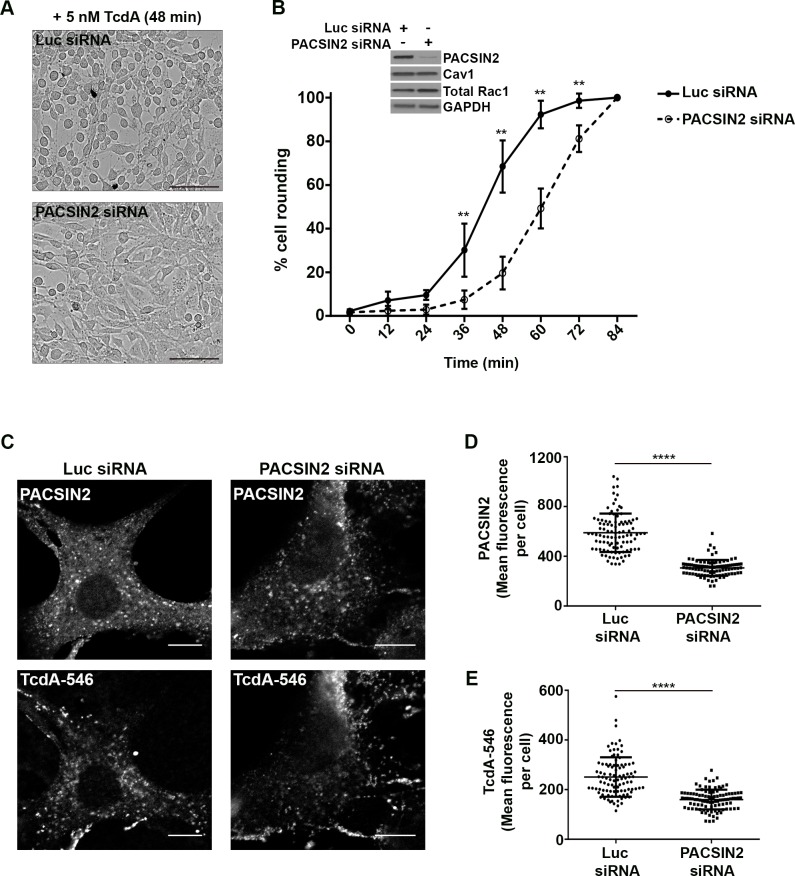
Fig 5. PACSIN2 is required for TcdA uptake and toxin-induced rounding in wildtype MEF cells.
(A) and (B) Depletion of PACSIN2 delays TcdA-induced cell rounding in wildtype MEF cells. MEF cells transfected with luciferase (non-targeting) or PACSIN2 siRNA were challenged with 5 nM TcdA, and toxin-induced cell rounding effects were monitored using an imaging-based kinetic assay as described in Materials and Methods. Representative images of cells 48 min post-toxin treatment are shown in (A). Scale bars, 100 μm. (B) The percentage of rounded cells in each siRNA condition was quantified for the indicated time points. Data represent mean and SD of at least 1200 cells from three independent experiments. Data were analyzed using two-way ANOVA and p-values were generated using Sidak’s multiple comparisons test in GraphPad Prism. **p<0.005. Western blots of whole cell lysates shown in inset indicate that PACSIN2 siRNA transfection resulted in a significant decrease (96.3 ± 2.8%) in PACSIN2 protein levels but did not affect Cav1 or Rac1 levels in cells. (C), (D) and (E). Depletion of PACSIN2 reduces TcdA uptake in MEF cells. Wildtype MEF cells expressing luciferase (luc) or PACSIN2 siRNA were incubated with 50 nM TcdA-546 at 10°C for 45 min. Cells were allowed to warm up to 37°C for 2 min and then washed to remove unbound toxins and incubated with fresh media prewarmed to 37°C. Bound toxins were allowed to internalize for 9 min at 37°C. Cells were then fixed, stained for PACSIN2 and imaged by confocal microscopy. PACSIN2 and TcdA-546 staining from each condition are shown in (C). Scale bars, 10 μm. The images shown are representative of multiple fields imaged from two independent experiments. (D) Comparison of mean fluorescence intensities of PACSIN2 between luc and PACSIN2 siRNA transfected cells. Data represent mean and SD of 101 individual cells. Student’s t test ***p<0.0001. (E) Comparison of mean fluorescence intensities of TcdA-546 between luc and PACSIN2 siRNA transfected cells. Data represent mean and SD of 101 individual cells. Student’s t test ***p<0.0001. Cells were chosen at random for intensity analyses.

