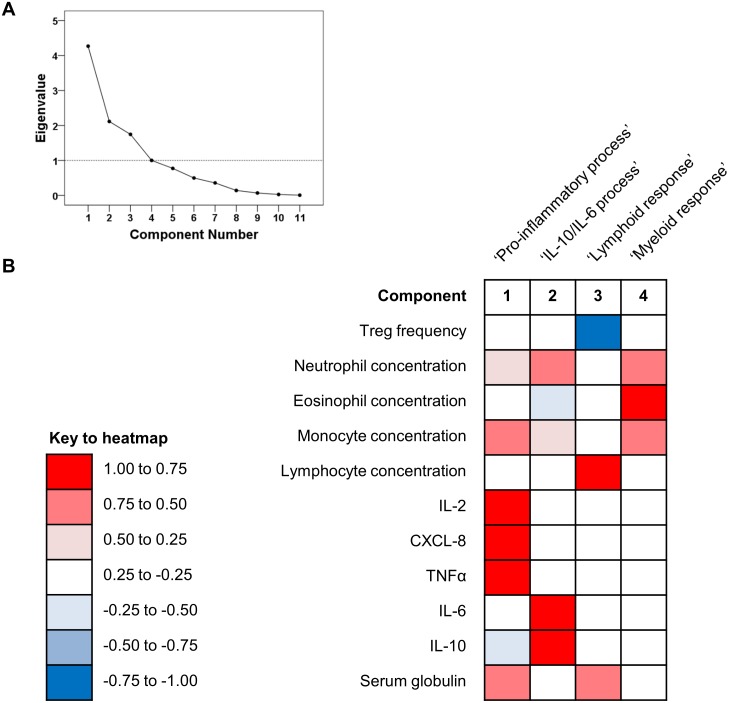
Fig 3. Results of principal component analysis (n = 16 dogs).
Four variables explained the majority of the variability in the dataset, as indicated in the scree plot (A). The loading scores represented in the heatmap (B) indicate the strength of correlation, either positive or negative, between individual variables and the components extracted in this model. Strong positive (>0.5) or negative (< -0.5) correlations indicate that the variable contributed greatly to the component, whereas weaker correlations indicate that the variable made little contribution to the component.

