Figure 3.

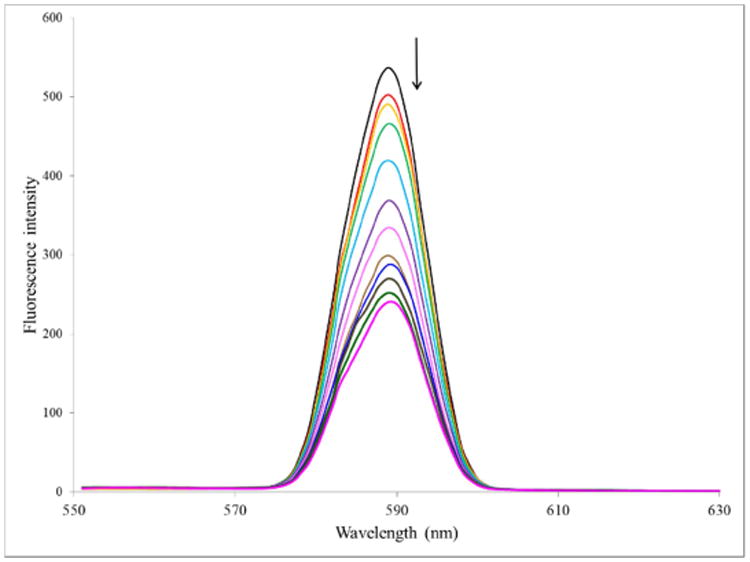
Emission spectra of complex 1 in the absence and presence of increasing amounts of ct-DNA, λex = 294 nm, [1] = 10 μM, [DNA] = 0 – 12 in 1 μM increments. Temperature = 303 K

Emission spectra of complex 1 in the absence and presence of increasing amounts of ct-DNA, λex = 294 nm, [1] = 10 μM, [DNA] = 0 – 12 in 1 μM increments. Temperature = 303 K