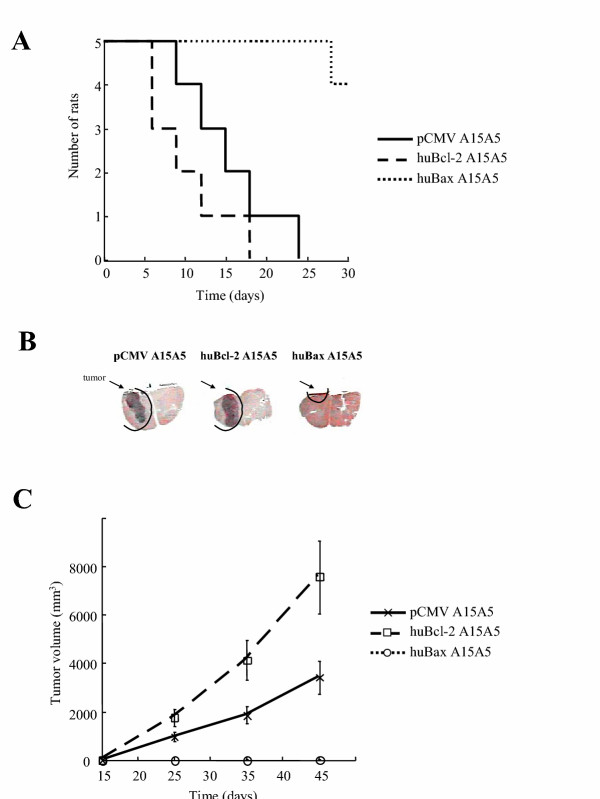
Figure 3.

A. Growth of pCMV, Bcl-2 and Bax clones in BDIX syngenic rats. 105 cells from each clone were injected ic and rat survival was quantified using a Kaplan-Meier analysis. The curve illustrated is representative of 3 independent experiments. Each point represents the mean growth of 6 rats (3 rats per clone). B. The macroscopic observation of the tumors induced by the ic injection of huBcl-2, pCMV and huBax A15A5 cells into rat brains. Rat brains were stained with hematoxylin. C. Subcutaneous growth was followed by measuring the tumoral volume every 10 days after the injection of the cells. The curve illustrated is representative of 3 independent experiments. Each point represents the mean growth of 6 rats (3 rats per clone).
