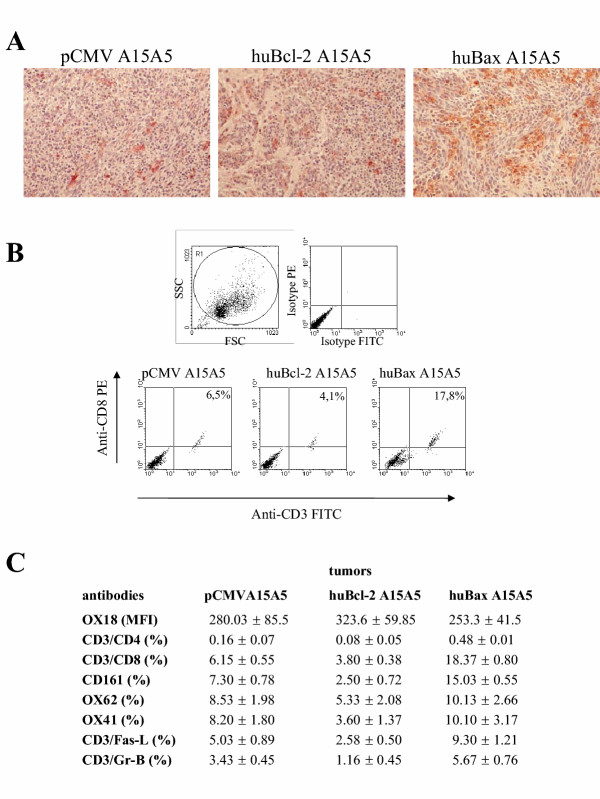
Figure 5.

A. Qualitative analysis of CD8+ infiltrating lymphocytes by immunohistochemistry. B. Flow cytometric analyses of intra-tumoral CD8+ CTLs. Dot plots show the expression of CD3+ and CD8+ cells in the dissociated tumors. The percentages indicate the double positive cells for the three types of tumors. Results are representative of three independent experiments. C. Phenotypes of the intra-tumoral cells by flow cytometry. Tumors were treated as described in materials and methods. Results presented here are the mean of 3 independent experiments.
