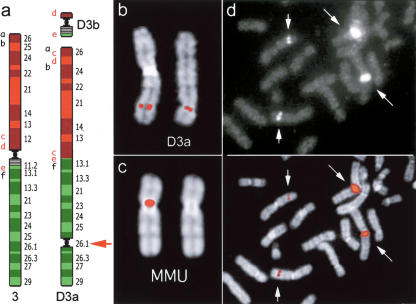
Figure 2.
Neocentromere case 1. (a) Diagram of the rearrangement that generated the derivative chromosomes D3a and D3b of neocentromere case 1. Several BAC probes were used to define the rearrangement. The most informative BACs, reported in a as letters in lower case, are reported in the Supplemental Table 3. Letters in red refer to probes yielding splitting signals. These data suggest that the segment defined by BACs c-e was excised from its original position and inserted between a and b; then a second excision extracted the fragment d-e, containing the centromere, to form the minichromosome D3b. The red arrow indicates the position of the neocentromere. (b) Partial metaphase from case 1 showing the normal chromosome 3 (left) and the derivative D3a (right) with FISH signals of the BAC RP11-498P15 (nc1 in Fig. 1), mapping at the neocentromere (see text). (c) (Left) FISH signal of BAC RP11-498P15 on macaque chromosome 3. (Right) The chromosome is shown without the signal for a better identification of the centromere. Note that MMU chromosome 3 is upside down in Figure 1. (d) Partial metaphase from a normal individual showing FISH signals of probe RP11-418B12 (K2 in Fig. 1 and Table 1), mapping on the opposite side of the MMU centromere with respect to BAC RP11-498P15, showing a strong signal on the heterochromatic block of chromosome 1. The image with signals only (top) and the merged image (bottom) are separately reported to better show how the signals appear on the microscope. Note the normal signals on chromosome 3 (short arrows) and the large signals on the heterochromatic block of chromosome 1 (long arrows).

