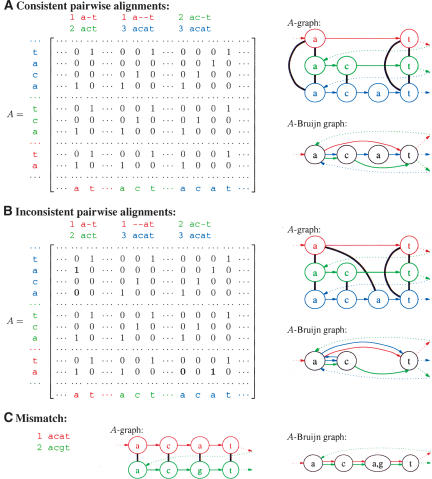
Figure 6.
Construction of A-Bruijn graphs from (A) consistent pairwise alignments and (B) inconsistent pairwise alignments, for the genomic sequence...at...act...acat... with a repeat represented by three copies: at, act, acat. In the A-graphs, the thick, black edges connect vertices according to the adjacency matrix A. In the A-Bruijn graph, the colored edges show how the sequence threads through the vertices; they are also shown in the A-graph but technically are not part of it. Gaps in pairwise alignments create bulges in the A-Bruijn graph; for example, the third alignment in example A creates a bulge on vertices c, a, and t consisting of three edges (c, a), (a, t), and (c, t). Inconsistencies in pairwise alignments create whirls; for example, a blue whirl a → c → a in B. (C) A-graph and A-Bruijn graphs of a mismatch in the genomic sequence...acat...acgt....

