. 2016 Nov 19;5:e19735. doi: 10.7554/eLife.19735

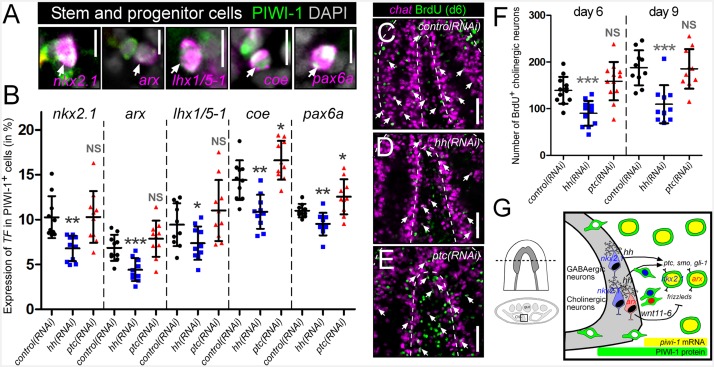
Figure 6. hh signaling regulates homeostatic neurogenesis.

(A) Single confocal plane images displaying examples of neural progenitor cells (white arrow), PIWI-1+ stem/progenitor cells that express neural transcription factors. Scale bar = 10 µM. (B) Quantification of neural progenitor levels in animals with altered levels of hh signaling. Graphs are dot plots measuring the percentage of PIWI-1+ cells that express each neural transcription factor. n = 10, *p<0.05, **p<0.01, ***p<0.001, error bars are standard deviation. (C–E) Single confocal planes displaying newly generated cholinergic neurons in the planarian brain 6 days after a single BrdU pulse (white arrows). Scale bar = 100 µm. (F) Dot plot quantifying the number of new cholinergic neurons. n ≥ 10, ***p<0.001, error bars are standard deviation. (G) Model displaying nkx2.1+ and arx+ neural stem and progenitor cells and the mature neurons that they produce. These same neural cell types also express the hh signaling molecule, which signals back onto adult stem cells, maintaining normal proliferation levels, and homeostatic neurogenesis.

DOI: http://dx.doi.org/10.7554/eLife.19735.019

Figure 6.

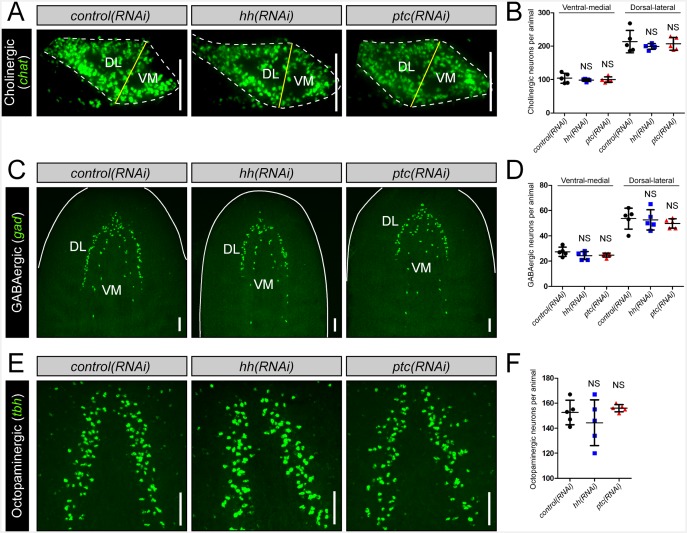
Figure 6—figure supplement 1. hh signaling levels do not affect existing neuronal subpopulations in the intact brain.

Figure 6—figure supplement 1.

(A) Projected confocal images showing cholinergic neurons from 20 µm – thick recordings, of single brain lobes from transverse sections through the anterior-posterior midpoint of the brain. The plane of division (yellow line) separating the VM and DL brain halves occurs at the naturally occurring dorsal and ventral vertices of the brain lobe. (B) Quantification of cholinergic neurons observed in the VM and DL regions of a single brain lobe. (C) Projected confocal image showing GABAergic neurons. (D) Quantification of VM and DL GABAergic neurons. (E) Projected confocal images showing octopaminergic neurons. (F) Quantification of octopaminergic neurons. All images are from animals subjected to 10 RNAi feedings. Dashed lines represent the outer border of the CNS. Solid white lines represent the outer border of the animal. Scale bars = 100 µm. All graphs are dot plots showing value mean ± standard deviation.
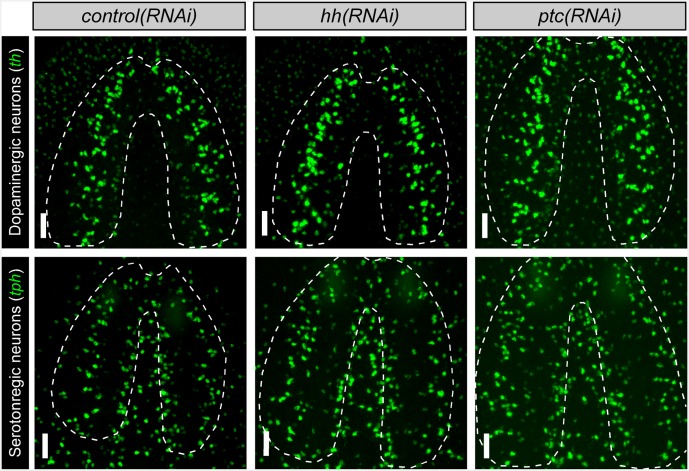
Figure 6—figure supplement 2. hh signaling levels do not affect existing neuronal subpopulations in the intact brain Projected confocal images showing dopaminergic and serotonergic neurons after six RNAi feedings to knockdown hh or ptc.

Figure 6—figure supplement 2.

Dashed lines represent the outer border of the CNS. Scale bars = 50 µm.
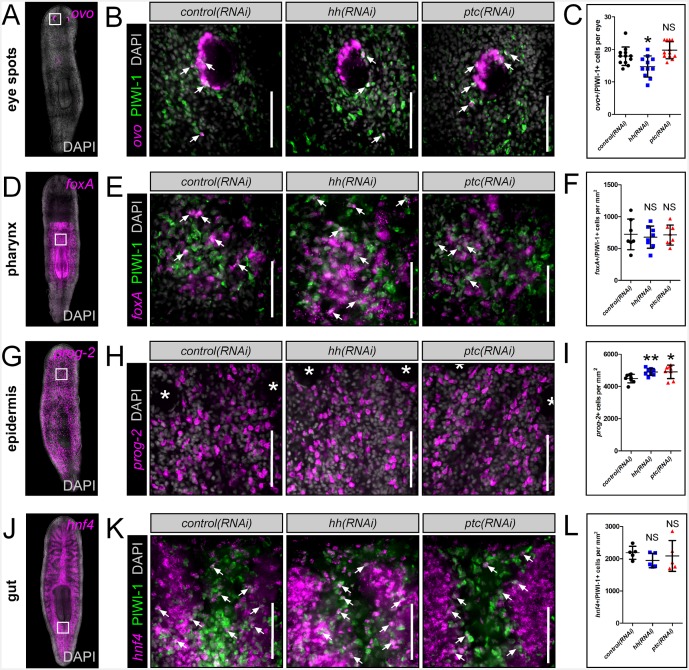
Figure 6—figure supplement 3. hh signaling levels do not affect other planarian progenitor populations.

Figure 6—figure supplement 3.

(A, D, G, J) WISH images showing expression domains of planarian tissue markers for the eye spots (ovo), pharynx (foxA), epidermis (prog-2), and gut (hnf4). (B, E, H, K) Single confocal planes showing tissue specific progenitors after RNAi knockdown of hh or ptc. Region of interest is represented by the white boxes in (A, D, G, and J). Scale bars = 100 µm. (C, F, I, L) Quantification of tissue progenitors after hh or ptc RNAi knockdown. All graphs are dot plots, showing the value mean ± standard deviation. *p<0.05, **p<0.01.
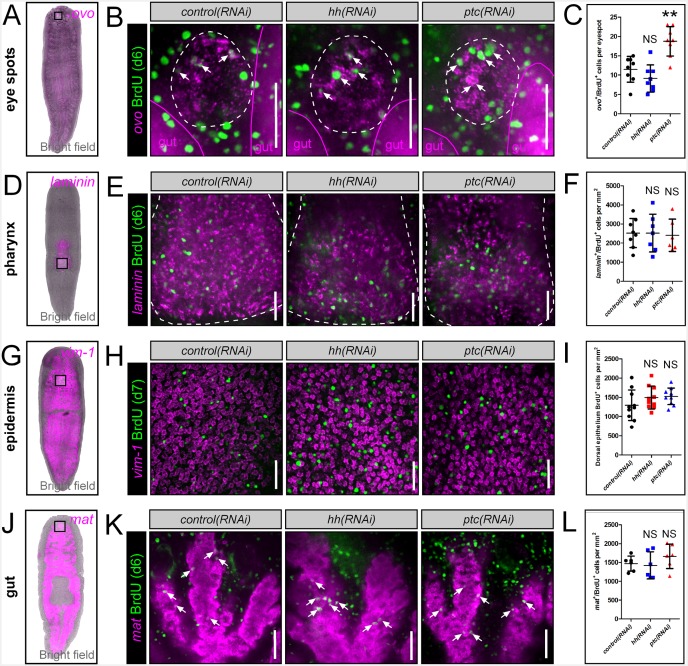
Figure 6—figure supplement 4. hh signaling levels do not affect BrdU incorporation into other planarian tissues.

Figure 6—figure supplement 4.

(A, D, G, J) WISH images showing expression domains of planarian tissue markers for the eye spots (ovo), pharynx (laminin), epidermis (vim-1), and gut (mat). (B, E, H, K) Single confocal planes showing BrdU incorporation into mature tissues after RNAi knockdown of hh or ptc. Region of interest is represented by the white boxes in (A, D, G, and J). Scale bars = 100 µm. (C, F, I, L) Quantification of BrdU incorporation after hh or ptc RNAi knockdown. All graphs are dot plots, showing the value mean ± standard deviation. **p<0.01.