
Figure 1. Proteomic characterization of Camponotus floridanus trophallactic fluid.
(A) Heat map showing the percentage of total molecular weight-normalized spectra assigned to proteins from voluntary TF, forced TF, midgut, or hemolymph fluids (normalized spectral abundance factor, NSAF [Zybailov et al., 2006]). C1-C10 indicate colony of origin. Forced trophallaxis samples are pooled from 10 to 20 ants, hemolymph from 30 ants, and the contents of dissected midguts from five ants each. Voluntary and midgut samples were collected from ants of multiple colonies; multiple samples are differentiated by letters. Approximately unbiased (AU) bootstrap probabilities for 10,000 repetitions are indicated by black circles where greater or equal to 95%. (B) Trophallaxis samples from the same ants, in-colony and group-isolated. Trophallactic fluids were sampled first upon removal from the colony, then after 14 days of group isolation (20–30 individuals per group). Values were compared by spectral counting, and the dendrogram shows approximately unbiased probabilities for 10,000 repetitions. Along the right side, asterisks indicate Bonferroni-corrected t-test significance to p < 0.05 between in-colony and isolated TF. Approximately unbiased (AU) bootstrap probabilities for 10,000 repetitions are indicated by black circles where greater or equal to 95%. (C) The most abundant proteins present in TF sorted by natural-log-scaled NSAF value. The UniProt ID or NCBI ID is listed to the right. (D) A dendrogram of proteins including all proteomically observed juvenile hormone esterases (JHE)/Est-6 proteins in C. floridanus, the orthologs in D. melanogaster and A. mellifera, and biochemically characterized JHEs. Each protein name is followed by the UniProt ID. C. floridanus JHE/Est-6 proteins are listed with the fluid source where they have been found. Names are color-coded by species. Bootstrap values >95% are indicated with a black circle. JHE/Est-6 6 (E2AJL7) is identified by PEAKS software but not by Scaffold and consequently is not shown in the proteomic quantifications in panels (A–C).

Figure 1—figure supplement 1. Proteomic characterization of C. floridanus trophallactic fluid.
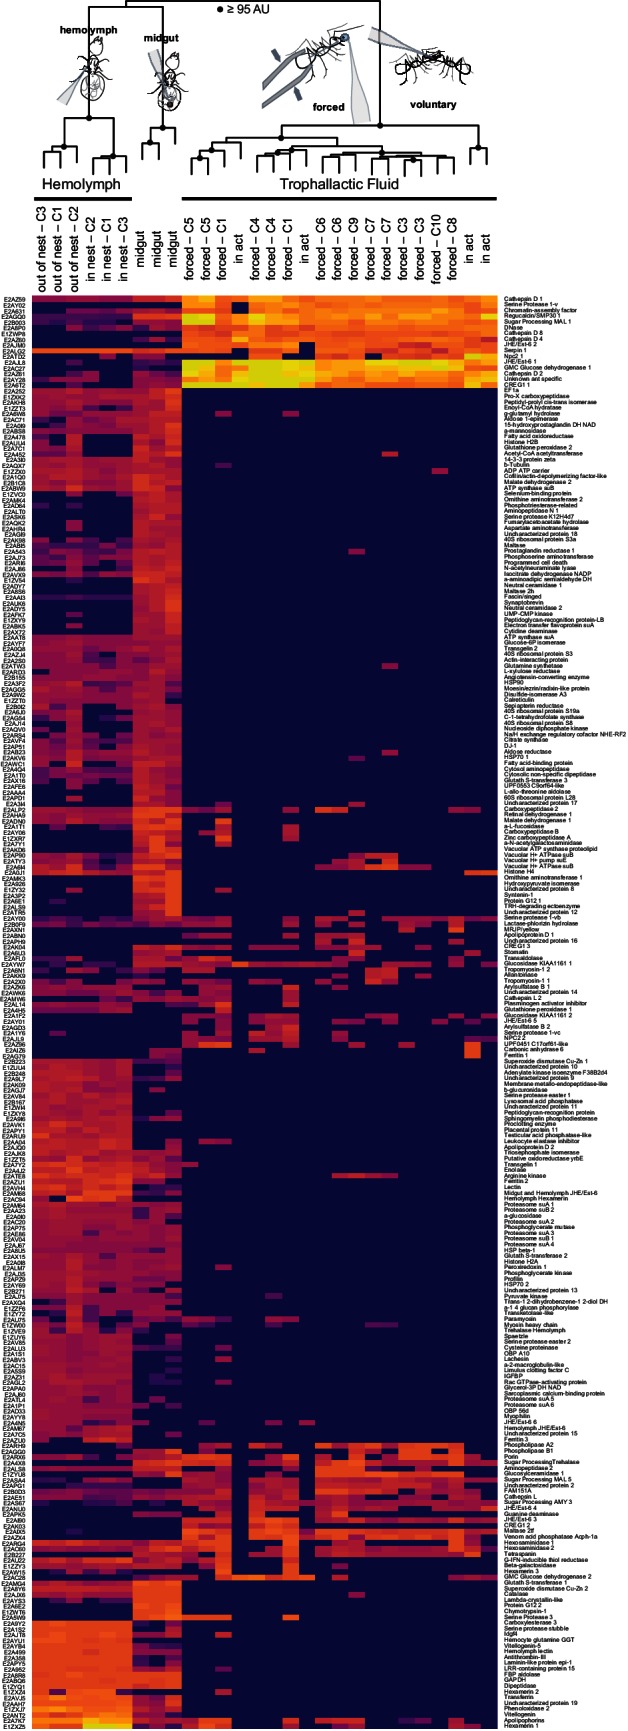
Figure 1—figure supplement 2. Social isolation influences trophallactic fluid content.
