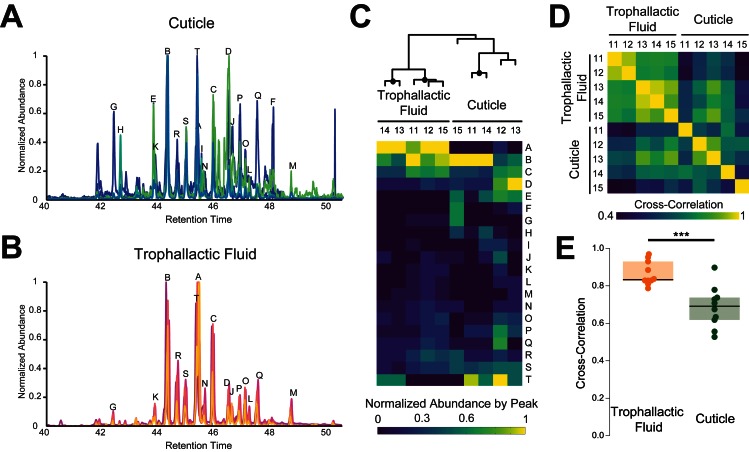
Figure 3. Trophallactic fluid of C. floridanus contains cuticular hydrocarbons.
(A–B) Gas chromatography-mass spectrometry profiles in the retention time window for cuticular hydrocarbons (C28–C37), from hexane extracts of whole body (A) and from trophallactic fluid (B). Samples were extracts from whole body and trophallactic fluid for five groups of 20–38 ants. Each group of ants is from a different colony, C11-C15. Different colonies are shown in distinct colors. Source data in Figure 3—source data 1. The abundant component (peak A) found in TF samples but not on the cuticle was a cholesterol-like molecule that insects cannot synthesize but must receive from their diet. Three molecules outside this window were found only in TF and not on the cuticle: *-tricosene, oleic acid, ethyl oleate (Table 1). All have been reported to be pheromones in other insect species (Wang et al., 2011; Le Conte et al., 2001; Mohammedi et al., 1996; Choe et al., 2009). (C) A hierarchically clustered heatmap of the dominant peaks in the range of retention times for long-chain cuticular hydrocarbons. The dendrogram shows approximately unbiased probabilities for 10,000 repetitions. Approximately unbiased bootstrap values > 95% are indicated with black circles. Letters along the right correspond to individual peaks in (A) and (B). (D) Normalized pair-wise cross-correlation values for each TF and body hydrocarbon profile for each of the five colonies. Source data in Figure 3—source data 2. (E) Normalized pair-wise cross-correlation values between TF hydrocarbon profiles and between body hydrocarbon profiles indicate that the TF hydrocarbon profiles are significantly more similar than are body hydrocarbon profiles. Median values and interquartile ranges are shown. t-test, p<0.0003.


