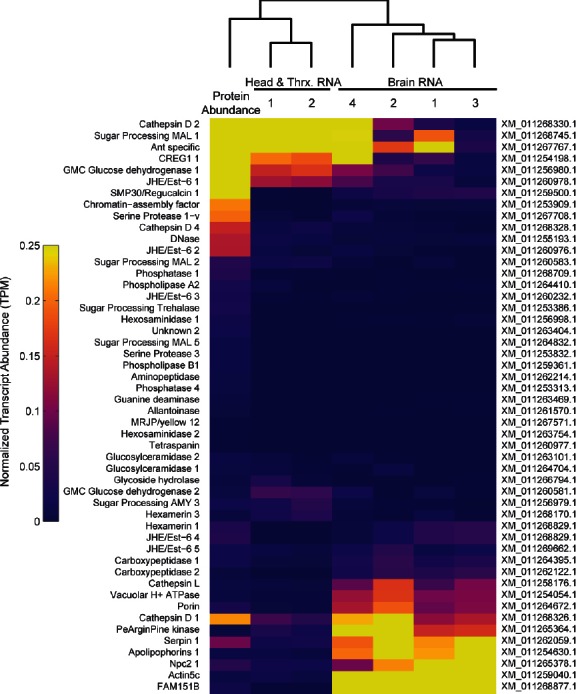
Author response image 1. Heatmap comparing TF protein abundance with RNA expression of the same genes in brain, head and thorax samples from RNA-Seq datasets (Simola et al. Genome Research 2013).

Expression values are calculated as transcripts per million (TPM) reads, and normalized for presentation on the same scale as proteomic data from Figure 5 (NSAF).
