Figure 1.
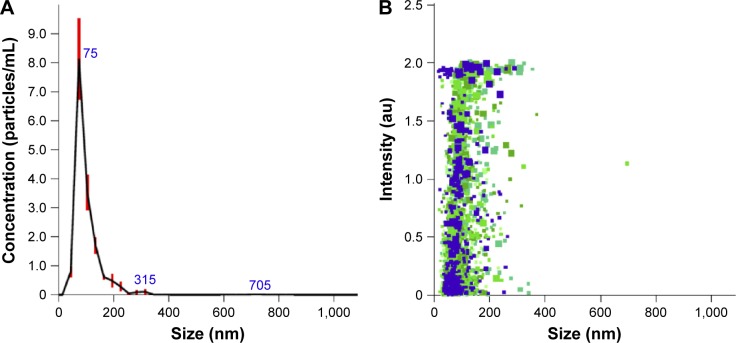
Particle size distribution vs nanoparticles concentration and intensity of scattered light obtained by NTA.
Notes: Particle size distribution is expressed as average and standard error of the mean of nanoparticle concentration (n=5) (A). Different colors and sizes of markers represent measures of particle size and scattered light intensity of single particles from the five independent experiments (B).
Abbreviation: NTA, nanoparticles tracking analysis.

