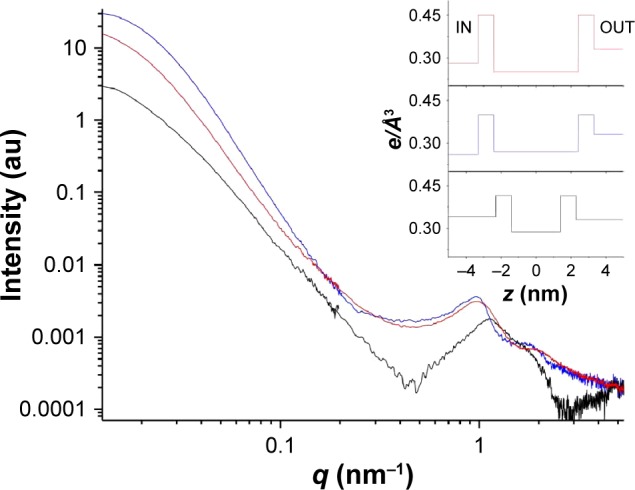
Figure 3.

SAXS intensity spectra of LCN (black line), LCN_MaiLab (blue line), and SVT-LCN_MaiLab (red line).
Notes: The corresponding electron density profiles (e/Å3) across the bilayer are shown in the insert. IN is the core region, and OUT is the bulk solvent region and z is the distance from the center of the bilayer. (e/Å3) is the electron density for number of electrons/volume.
Abbreviations: SAXS, small-angle X-ray scattering; LCNs, lecithin/chitosan nanoparticles; Mai, Maisine; Lab, Labrafac; q, momentum transfer.
